


We’ve dived into the recently-released MOT data for 2021 to find out what it tells us about the UK’s drivers (and how they might be able to save money in these tough times).
We’ll also reveal the most reliable makes and models, the best times to book your test, and even which colour cars have the best and worst pass rates (spoiler: neither is aubergine purple).
Contents.
- Overall mileage trends.
- What it all means for car insurance.
- Saving money.
- Pass rates.
- Mileage by fuel types.
- The best time to book your MOT.
- The most (and least) successful colours.
- The best (and worst) makes and models.
Mileage didn’t bounce back after the pandemic.
Not by a long shot.
In our look at the last set of MOT data (which was for 2020), we made the not-very-bold prediction that average mileage would be down from 2019. And it was – falling by a whopping 557 miles, from 7,090 to 6,533.
Lockdown restrictions eased during the first half of 2021, before being dropped by the summer. So you might expect mileage to have gone back up a bit – if not all the way to pre-pandemic levels. But you’d be wrong.
In fact, average annual mileage dropped by more than 1,000 miles to just 5,398. That’s a 24% drop compared to pre-pandemic levels.
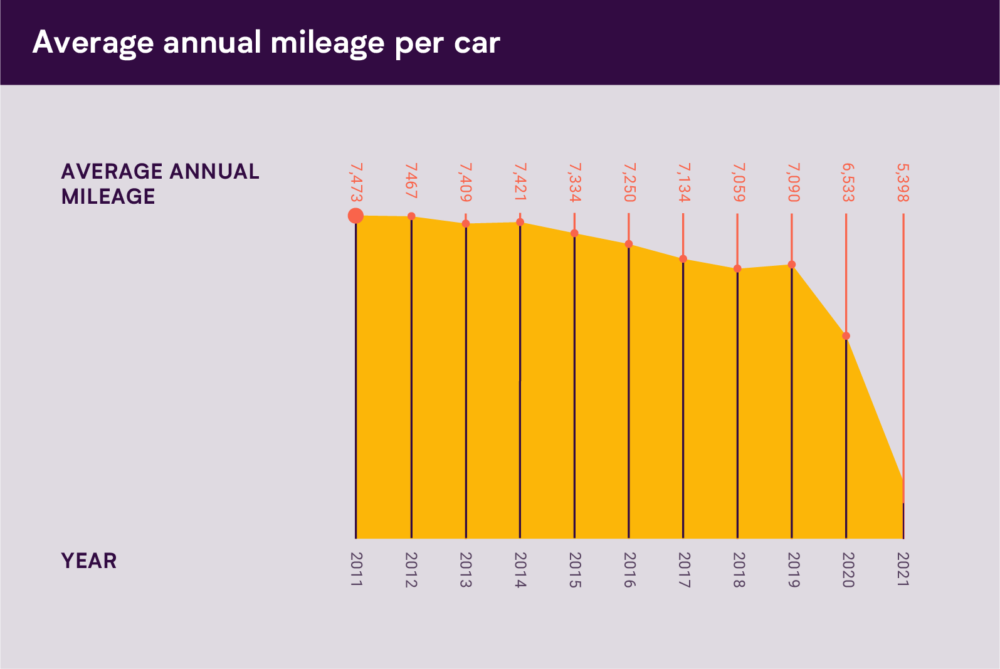
Talking of pre-pandemic driving, it’s worth remembering that mileage had been falling consistently over the last decade. Covid didn’t create this trend for driving less – it just took it to a new extreme. And if this data is anything to go by, that ‘extreme’ isn’t extreme at all. It’s just how people use their cars now – even without any lockdowns to think about.
Unfortunately, since 2021, we’ve been hit by a cost of living crisis. We know from our own research that since inflation really started taking off, half of people have started driving less to save money.
With that in mind, people might actually be using their cars even less than this data suggests.
What does this mean for car insurance prices?
Our pay-by-mile approach to car insurance is built on the idea that cover should cost less if you drive less. These days most people are driving quite a lot less, so car insurance should generally be getting cheaper, right?
No. Unfortunately not.
Over the first half of 2022, prices were up 6% on average. That’s because, for most insurers, the mileage you do doesn’t really have a big impact on price. In fact, they often charge lower mileage drivers more.
Getting rewarded for your lower mileage.
If you’ve been driving less (and you probably have), it’s safe to assume you aren’t too thrilled by the idea of paying more for your insurance. But you might not have to.
When we started out, average mileage was around the 7,000 mile mark. Our pricing has always been designed to try and offer people a better deal if they drive around that amount or less. As the MOT data shows, these days, that’s a big old chunk of the population.
As various independent sources have pointed out, our way of doing things can be hundreds of pounds cheaper for all sorts of people – not just the very lowest mileage drivers. So, if you haven’t checked us out, grab a quick quote now. It only takes a moment.
(It’ll also tell you what mileage you’re currently doing if you’re not sure).
Right then. What else have we learnt from the new MOT data?
Pass rates are down a little…
The overall MOT pass rate was actually down a little from 2020, falling from 76.2% to 75.6%. It’s possible that, over lockdown, people weren’t thinking about their cars so much, and maybe skipped some of the maintenance they’d usually do.
…but not for newer cars.
Looking specifically at newer cars (aged 3-5 years) pass rates were up. They rose from 88.6% up to 89.3%. You’d guess that’s probably down to being used less.
The move to electric is still going pretty strong.
Looking at average mileage by fuel type, you can see that petrol cars are doing far fewer miles on average than electric cars and other hybrids. That makes sense. Our own research has shown richer households drive around 4 times as much as those on lower incomes. Given these vehicles can be pricey, they’re more likely to belong to those who are better off.
Diesel vehicles seem to do the most miles, probably due to being used in haulage.
| Fuel type | Average annual mileage |
| Gas Diesel | 11069 |
| Electric Diesel | 8113 |
| Hybrid Electric (Clean) | 7317 |
| Fuel Cells | 7039 |
| Other | 6983 |
| Diesel | 6700 |
| Electric | 6431 |
| Gas Bi-Fuel | 6298 |
| LPG | 6042 |
| CNG | 5388 |
| Gas | 4610 |
| Petrol | 4290 |
| Steam | 3617 |
| LNG | 3217 |
Leave your MOT for later in the week.
Last time we dived into the data, we found that pass rates rose steadily through the week – with Monday being the worst time for a test and Sunday being the best. The new data shows the exact same trend.
It’s not a minor thing either. Cars tested on a Sunday pass 8% more often.
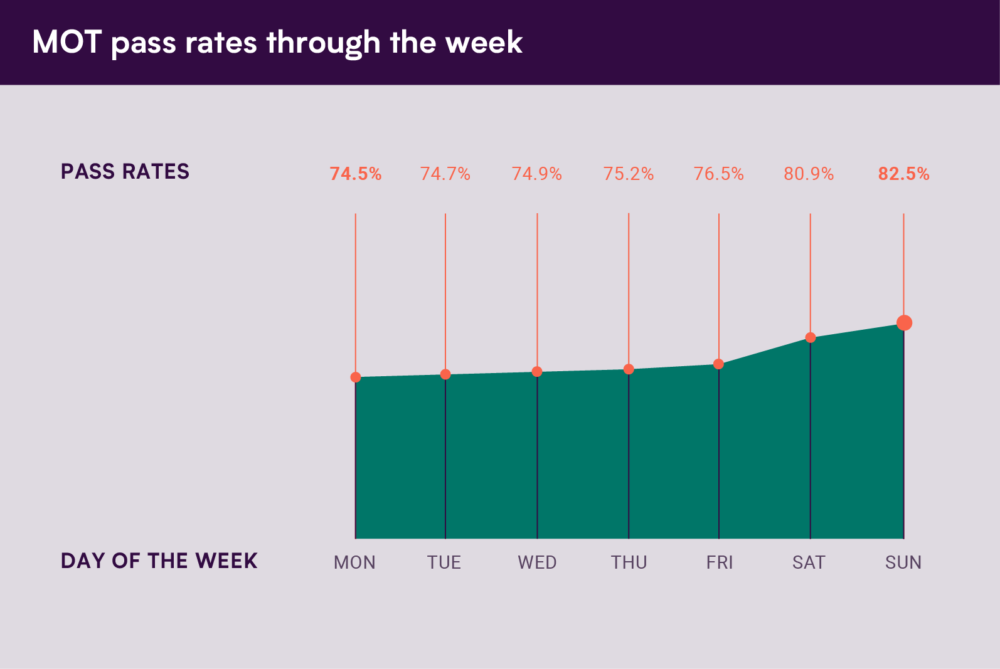
If you can figure out a good reason for this, let us know. The best we can come up with is the Monday blues hitting hard and then gradually wearing off…
Talking off booking your MOT, you can use our checker tool to find out when your’s is due.
Make hay while the sun shines. And get your MOT done too.
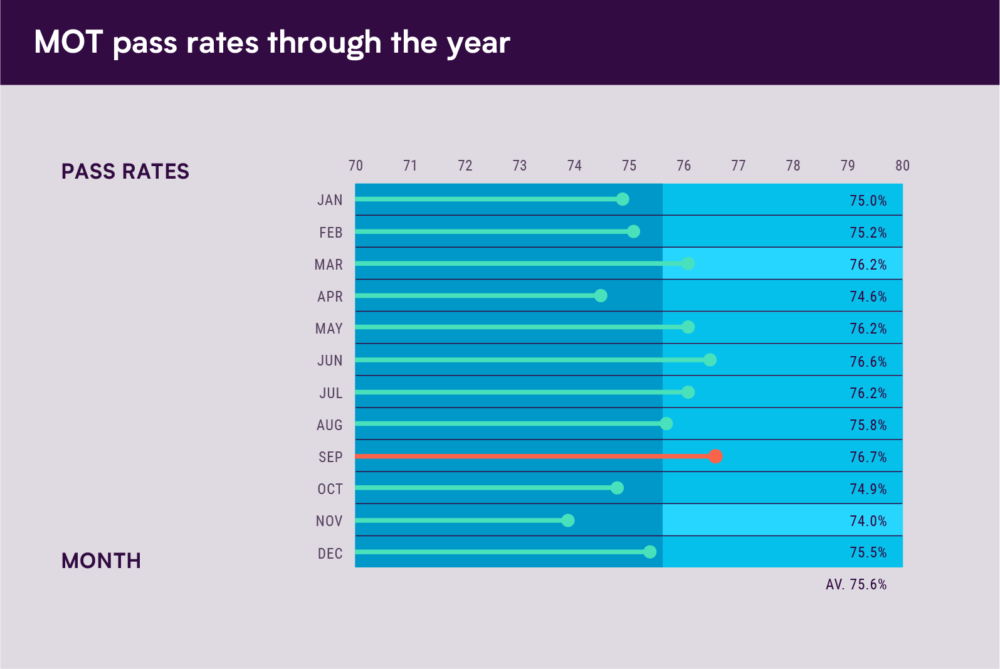
As in previous years, the new data shows that pass rates are a little higher from late spring, through summer and into early Autumn. From there, they dip as the cold weather takes hold.
Will you use this information to book your MOT at the best possible moment, or leave it until it’s due? Only time will tell.
Boxing day special? Probably not.
On boxing day 2021, 93.3% of cars tested passed their MOT. That’s the highest percentage for any single day out of the whole year. That said, there were only 120 tests done, whereas you’d usually expect thousands. Maybe not one to read too much into.
Bronze takes gold.
At an impressive 91.7%, bronze cars have the best pass rate of any colour. Turquoise, which was the previous champion, was just 0.1% off. Tough luck.
Multi-coloured cars did worst (maybe due to being frankenstein vehicles made of various spare parts). Maroon, Black, White and Pink make up the rest of the bottom five.
If you have a multicoloured car that’s maroon, black, white, and pink, you may as well give up hope.
The top 5 manufacturers are very familiar…
Looking at cars that are 3-5 years old gives a good indicator of their true reliability. If we focus on this age range, we find the top 5 models are mostly Japanese – just like the 2020 data. In fact, the entire top 5 is completely unchanged.
In terms of the actual pass rates, all of the top 5 makes did slightly better this time around (aside from a tiny dip for Toyota).
| 2020 | 2021 | ||
| Make | Pass rate (%) | Make | Pass rate (%) |
| Lexus | 94.1 | Lexus | 94.7 |
| Honda | 93.9 | Honda | 94.1 |
| Porsche | 93.6 | Porsche | 94 |
| Toyota | 92.4 | Toyota | 92.3 |
| Suzuki | 91.9 | Suzuki | 92.3 |
…as do the top 5 models.
Unlike the unpredictable music it’s named after, you know exactly what you’re getting with the Honda Jazz. They’re as reliable as they come. The hatchback retains its crown as the best performing model in the 3-5 year age range for a third year in a row.
The CR-V slips to third, only to be replaced by yet another Honda – the HR-V. The Suzuki Celerio clings to its top 5 spot, while the Audi Q2 slides into 4th spot as the only European model on the list.
| 2020 | 2021 | ||
| Model | Pass rate (%) | Model | Pass rate (%) |
| Honda Jazz | 94.1 | Honda Jazz | 95.5 |
| Honda CR-V | 93.9 | Honda HR-V | 94.8 |
| Suzuki Celerio | 93.6 | Honda CR-V | 94.5 |
| Toyota RAV4 | 92.4 | Audi Q2 | 93.9 |
| Mercedes-Benz GLA | 91.9 | Suzuki Celerio | 93.6 |
The bottom 5 makes are all European. Again.
The bottom 4 makes (for the 3-5 year age range) are the same this time round as they were in the 2020 data. Dacia managed to lift themselves out of the list of shame, while Peugeot slipped in to take their place.
In the last set of data, 3 of the bottom 5 were French brands. Now, it’s 4. Sacre bleu!
| 2020 | 2021 | ||
| Make | Pass rate (%) | Model | Pass rate (%) |
| Dacia | 86.7 | Peugeot | 88.2 |
| Vauxhall | 86.5 | Vauxhall | 87.5 |
| Renault | 85.4 | Renault | 86.7 |
| DS | 85.3 | DS | 86 |
| Citroen | 84.7 | Citroen | 86 |
The worst models have gotten worse.
Looking at pass rates for cars aged 3-5 years, the bottom 5 all performed worse than in the previous year’s data. Of those models, 4 of the bottom 5 are the same – with the Mercedes Vito the only new entry to ‘earn’ its place among the bottom of the pile.
| 2020 | 2021 | ||
| Make | Pass rate (%) | Model | Pass rate (%) |
| Volkswagen Caddy | 82.9 | Volkswagen Caddy | 82.3 |
| Vauxhall Insignia | 82.8 | Mercedes Vito | 81.5 |
| Citroen Berlingo | 82 | Citroen Berlingo | 80.2 |
| Renault Trafic | 80 | Vauxhall Vivaro | 79.6 |
| Vauxhall Vivaro | 79.7 | Renault Trafic | 78.9 |


