


There’s a lot you can learn from MOT data. We’ve dived into the newly-released numbers from 2020 to see what they have to say about the nation’s driving habits – and what that might mean for people looking for cheaper car insurance. We also uncovered a bunch of other interesting stats that might help with your MOT (or at least make for some tough pub quiz questions).
MOT report contents.
- Average mileage year on year.
- Why we’re driving less.
- Impact on insurance costs.
- Increasing pass rates.
- Mileage by fuel type.
- Pass rate by day of the week.
- Pass rate by month.
- Pass rate by colour.
- Top brands.
- Top models.
- Bottom brands.
- Bottom models.
- Appendix.
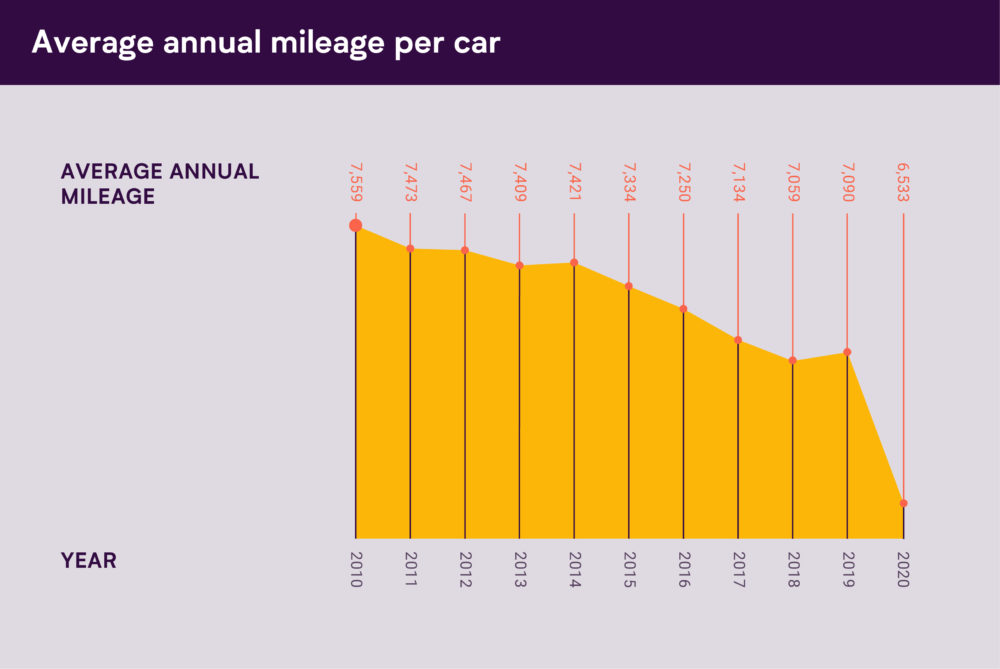
A decade of decreasing mileage.
On average, Brits have been steadily spending less and less time behind the wheel since the 2000s. With Covid keeping people off the roads, we made the not-very-bold prediction that the trend would continue in 2020. The data is out and (gasp!) it turns out we were right…
Before you rush to congratulate us, we should admit that we cheated a little. We made two predictions for average mileage in 2020 – one imagining that the lockdowns of Spring had continued throughout the year (5,960 miles) and one where they didn’t (6,970 miles). In reality, the average was in between, at 6,533 miles. As you can see below, this is still a pretty big drop…
(Psst? Here on a research mission? Go to the appendix to see the data from our graphs in an easy-to-copy-and-paste format. You’re very welcome.)
Even before the pandemic, mileage was consistently falling. In 2020 it took a big drop. We used a survey to try and find out what was behind this trend. Lockdowns were the safe assumption, but you know what they say about assuming…
Of the drivers we spoke to, 82% were driving the same miles or less than in previous years. The two most popular reasons were both related to the pandemic, but there were also other factors driving (or rather not driving) this dip in mileage.
The top 5 reasons for driving less.
| Reason | Percentage of respondents |
| There are less events/attractions to drive to | 37% |
| I’m working from home | 29% |
| I want to reduce my environmental impact | 17% |
| Other | 15% |
| I retired | 9% |
If you’re wondering what ‘other’ actually means, well, so were we. So we gave anyone picking this answer the chance to tell us what their exact reason was. Most answers name checked Covid, lockdowns, shielding, social distancing or staying in out of choice (likely because of the pandemic).
All of these could be considered temporary measures. However, we don’t expect mileage to jump up in the next set of data. For one thing, the impacts of the pandemic continue to drag on – for another, some of the changes it’s brought with it (like the rise of home working) are likely to stay in place for years to come.
Fewer miles means lower car insurance costs… Right?
With fewer people on the roads in 2020, there were fewer accidents and therefore fewer claims for car insurers to pay. Unfortunately, not many insurers passed these savings on to their customers…
Of the drivers we surveyed, 82% had not received any sort of refund from their insurers despite having driven much lower mileage than they estimated on their policy. On top of that, more than a quarter of those that did receive a refund on their premiums were unhappy with the amount. Ouch.
Of course, this wasn’t a problem for anyone on a pay-by-mile car insurance policy from a provider like, oh say, By Miles. With us, the less you drive, the more you save. If you ask us, that’s just fairer.
Right, that’s enough plugging. What else have we learnt from this new set of MOT data?
MOT pass rates are up.
It looks like doing fewer miles has left the nation’s cars in better condition. The pass rate went up in 2020 – jumping to 76.2% from 74.9% in 2019. Looking specifically at newer cars (aged 3-5 years) the rate went up to 88.6% from 87.4%.
Greener cars are doing more miles.
Drivers of hybrid and electric cars and doing more miles on average than petrol cars – and by some distance. (At 11,704, Teslas also have the highest annual mileage of any make – and they’re exclusively electric.)
| Fuel type | Average annual mileage |
| Electric diesel | 11,167 |
| Hybrid electric (clean) | 9,708 |
| Electric | 7,265 |
| Petrol | 5,893 |
For us, this isn’t a big shock. We conducted some independent research that revealed that higher income families drive four times further than poorer households. They are also – unsurprisingly – more likely to have a newer car. As all electric cars are relatively new, it makes sense that they tend to be in the hands of wealthier people who – on average – rack up more miles.
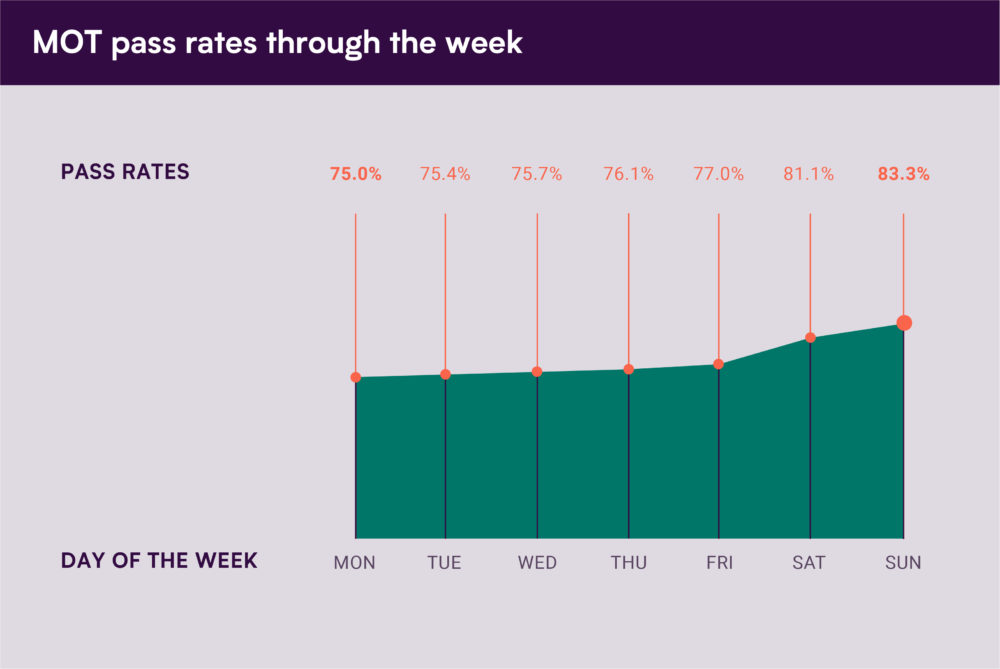
Leave your MOT for later in the week…
We can’t give a solid reason why, but the data clearly shows that pass rates improve as the week goes on. Maybe testers get the Monday blues? Who knows. But statistically, Sunday is your best bet (if you can find an MOT centre that’s open).
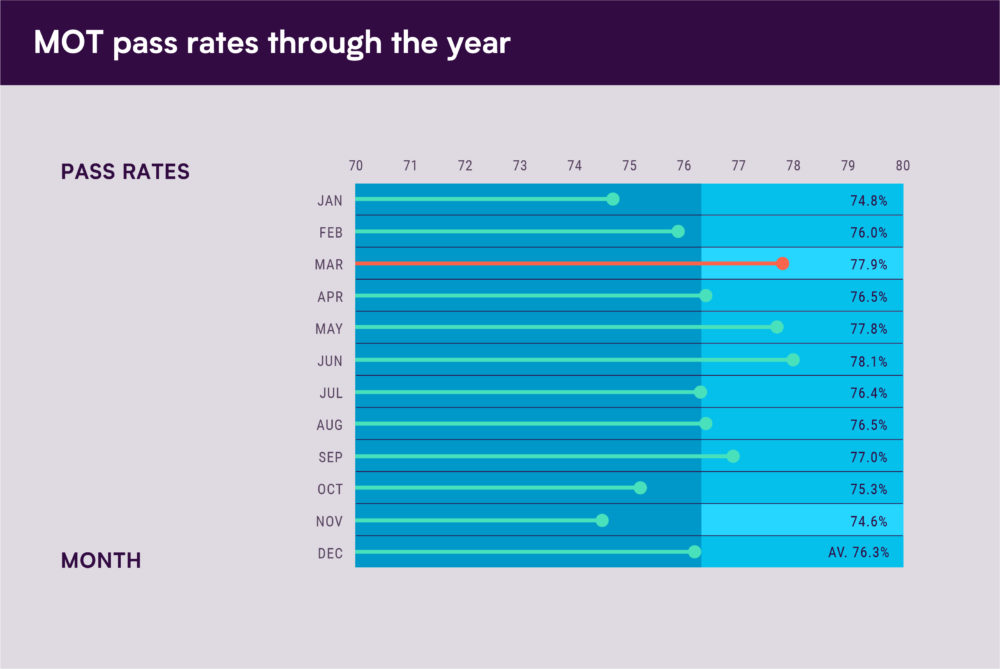
…and avoid booking an MOT in Winter.
As we’ve seen, the average pass rate was 76.2%. But this fluctuates throughout the year. We’ve noticed the pass rate is a little lower in January and February, climbs above average in March and then stays up all the way to September. It dips down again when Winter arrives.
The single best day of the year? With a pass rate of 92.9%, the 12th of April is statistically the best day of the year for an MOT. Must be the joys of Spring…
Multicoloured isn’t the way to go.
Putting the question of style aside, having a multicolour car seems to be a bad idea as far as MOTs go. The average pass rate for cars aged 3-5 years is 88.6%. Purple, black and white cars in this bracket all score slightly below this – but at just 76.5%, multicoloured cars lag a long way off the average.
The best colour is turquoise (obviously!). This nice green-y, blue shade passes 91.7% of the time. Beautiful.

Japan dominates the top 5 brands…
The top 3 brands remain unchanged, but improved their MOT pass rates a little compared to the 2019 data. Suzuki climbed a place and Mini dropped out of the top 5 at the expense of Toyota. That means 4 of the top 5 brands are Japanese (and the only one that isn’t – Porsche – is an expensive luxury brand).
| 2019 (Cars of 3-5 years) | 2020 (Cars of 3-5 years) | ||
| Brand | MOT pass rate (%) | Brand | MOT pass rate (%) |
| Lexus | 93.8 | Lexus | 94.1 |
| Honda | 93.7 | Honda | 93.9 |
| Porsche | 93.6 | Porsche | 93.6 |
| Mini | 91.6 | Suzuki | 92.4 |
| Suzuki | 91.4 | Toyota | 91.9 |
…and the top 5 models.
Overall the top 5 models of 2020 have outperformed their counterparts from the year before – probably a result of having driven less. Despite the Prius dropping out, the top 5 is still entirely Japanese except for the Mercedes GLA.
| 2019 (Cars of 3-5 years) | 2020 (Cars of 3-5 years) | ||
| Model | MOT pass rate (%) | Model | MOT pass rate (%) |
| Honda Jazz | 95.4 | Honda Jazz | 95.3 |
| Honda CR-V | 93.4 | Honda CR-V | 94.5 |
| Toyota Prius | 93.1% | Suzuki Celerio | 94.2 |
| Mercedes GLA | 92.8% | Toyota RAV4 | 93.3 |
| Toyota Rav 4 | 92.7% | Mercedes Benz GLA | 92.9 |
Another all-European showing in the bottom 5 brands.
As in 2019, the bottom 5 consists entirely of European brands. France has the not-very-honourable honour of being home to 3 of the bottom 5 brands. Ah well, c’est la vie.
| 2019 (Cars of 3-5 years) | 2020 (Cars of 3-5 years) | ||
| Brand | MOT Pass rate (%) | Brand | Pass rate (%) |
| Volvo | 86.2 | Dacia | 86.7 |
| Vauxhall | 85.9 | Vauxhall | 86.5 |
| Dacia | 85.8 | Renault | 85.4 |
| Citroen | 84.6 | DS | 85.3 |
| Renault | 82.7 | Citroen | 84.7 |
The bottom 5 models are actually worse than before.
Despite the general upward trend of pass rates, the 4 of the bottom 5 positions did worse in 2020 than 2019. Once again, European models make up the entire list. There’s a big change in that 4 of the new bottom 5 are vans (though classed as type 4 vehicles for MOT purposes). There were none in the previous bottom 5. It could be that these vehicles were still seeing a lot of commercial use when private vehicles were parked up due to lockdown.
| 2019 (Cars of 3-5 years) | 2020 (Cars of 3-5 years) | ||
| Model | MOT Pass rate (%) | Model | Pass rate (%) |
| Vauxhall Insignia | 84.4 | Volkswagen Caddy | 83 |
| Volvo V40 | 83.9 | Vauxhall Insignia | 82.1 |
| Renault Clio | 81.4 | Citroen Berlingo | 81 |
| Citroen DS3 | 81.0 | Renault Trafic | 80.1 |
| Renault Megane | 78.1 | Vauxhall Vivaro | 79.7 |
Appendix.
Average mileage by year, 2010-2020.
| Year | Average annual mileage per car |
| 2020 | 6,533 |
| 2019 | 7,090 |
| 2018 | 7,059 |
| 2017 | 7,134 |
| 2016 | 7,250 |
| 2015 | 7,334 |
| 2014 | 7,421 |
| 2013 | 7,409 |
| 2012 | 7,467 |
| 2011 | 7,473 |
| 2010 | 7,559 |
MOT pass rate by day of the week, 2020
| Day | MOT pass rate (%) |
| Monday | 75 |
| Tuesday | 75.4 |
| Wednesday | 75.7 |
| Thursday | 76.1 |
| Friday | 77 |
| Saturday | 81.1 |
| Sunday | 83.3 |
MOT pass rate by month of the year, 2020
| Month | MOT pass rate (%) |
| January | 74.8 |
| February | 76 |
| March | 77.9 |
| April | 76.4 |
| May | 77.7 |
| June | 78 |
| July | 76.2 |
| August | 76.3 |
| September | 76.8 |
| October | 75.1 |
| November | 74.4 |
| December | 75.9 |


