


Our analysis of 2.5 million car insurance quotes from MoneySuperMarket suggests that 19 million low mileage motorists in the UK (those who drive less than the UK average of 7,134 miles a year) are in danger of being over-charged for car insurance.
On average, motorists declaring between 5,000 and 6,000 miles a year are being charged an average of £233 more than those driving 11,000 miles a year.
Car insurance is a pretty simple concept. You pay your insurer for cover each year, and you’re protected in case the worst happens. The price you pay for your insurance is based on how likely your insurer thinks you are to make a claim. The lower risk you present (because of your great driving history, for example), the lower your insurance cost. That’s fair.
Your insurer will consider a whole range of factors to determine how risky you are, one of them being how much time you spend on the road. It stands to reason that if you’re parked up and not driving, you’re far less likely to have an accident. So car insurance premiums for lower mileage drivers should be cheaper, right? Wrong. Unfortunately, evidence shows that payments from lower mileage drivers are being used to subsidise the cost of insurance for higher mileage motorists. This just isn’t fair.
We analysed nearly 2.5 million car insurance quotes carried out on the comparison site MoneySuperMarket. We saw that lower mileage drivers (motorists who say they drive less than the national average) may actually be paying up to £389 more for their car insurance than higher mileage drivers.
According to the latest MoT data released by the Department for Transport, the average car in the UK is driven 7,134 miles each year, which (by our calculations) means that up to 19 million drivers are in danger of being over-charged for their car insurance.
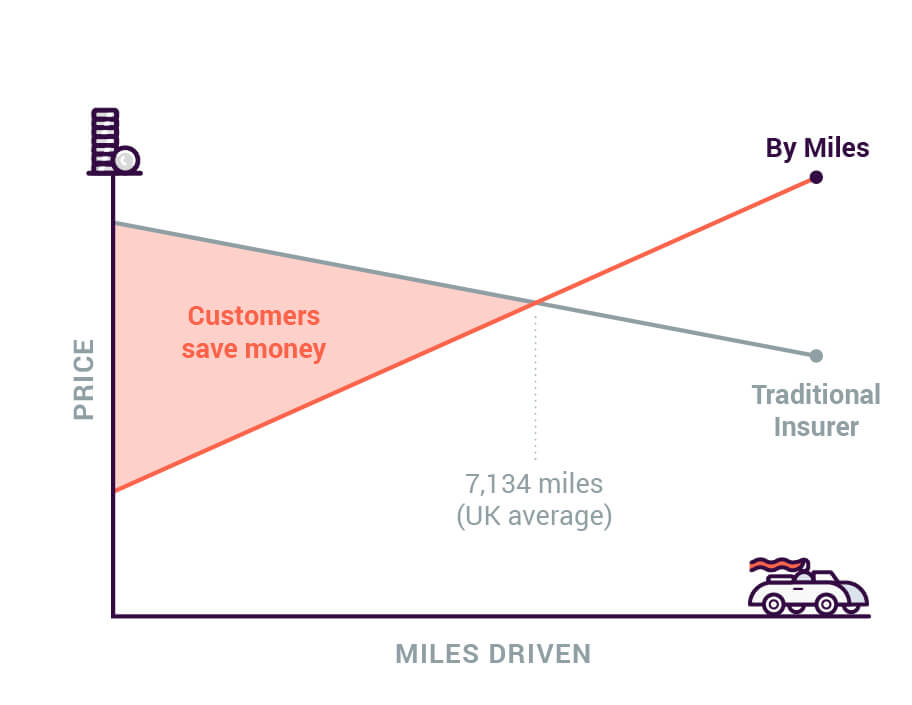
That’s why we launched a pay-by-mile policy in 2018. We thought it was about time lower mileage drivers were rewarded with a smarter and fairer kind of car insurance. This is now possible because, unlike many traditional insurance providers, we can accurately measure the miles our members drive. We believe that if you drive less, you should actually pay less. It’s pretty simple really.
Tom Flack, Editor-in-Chief at MoneySuperMarket said:
“It’s in our DNA to help drivers find the best deal on their car insurance, so it was a no-brainer to offer pay-by-mile insurance. We wanted to put the brakes on overcharging low-mileage drivers. If you drive less, you should pay less.
“It’s always been important to shop around to make sure you’re getting the best deal for your car insurance. That now includes looking at new technologies that offer drivers increasingly flexible ways of insuring their cars.”
Key facts and figures.
- The average car in the UK is driven 7,134 miles a year.
- 19 million cars in the UK are being driven under the national average mileage.
- We analysed 2.5 million customer quotes for car insurance on MoneySuperMarket.
- Nearly 40% of quotes were for an annual mileage between 5,000 – 8,000 miles a year.
- On average, motorists declaring between 5,000 and 6,000 miles a year are being charged an average of £233 more than those driving 11,000 miles a year.
- For a year of unlimited driving it costs just £103.90 more for car insurance than if you get a quote for driving under 1,000 (i.e. it will cost you just over £100 to drive 25x more each year).
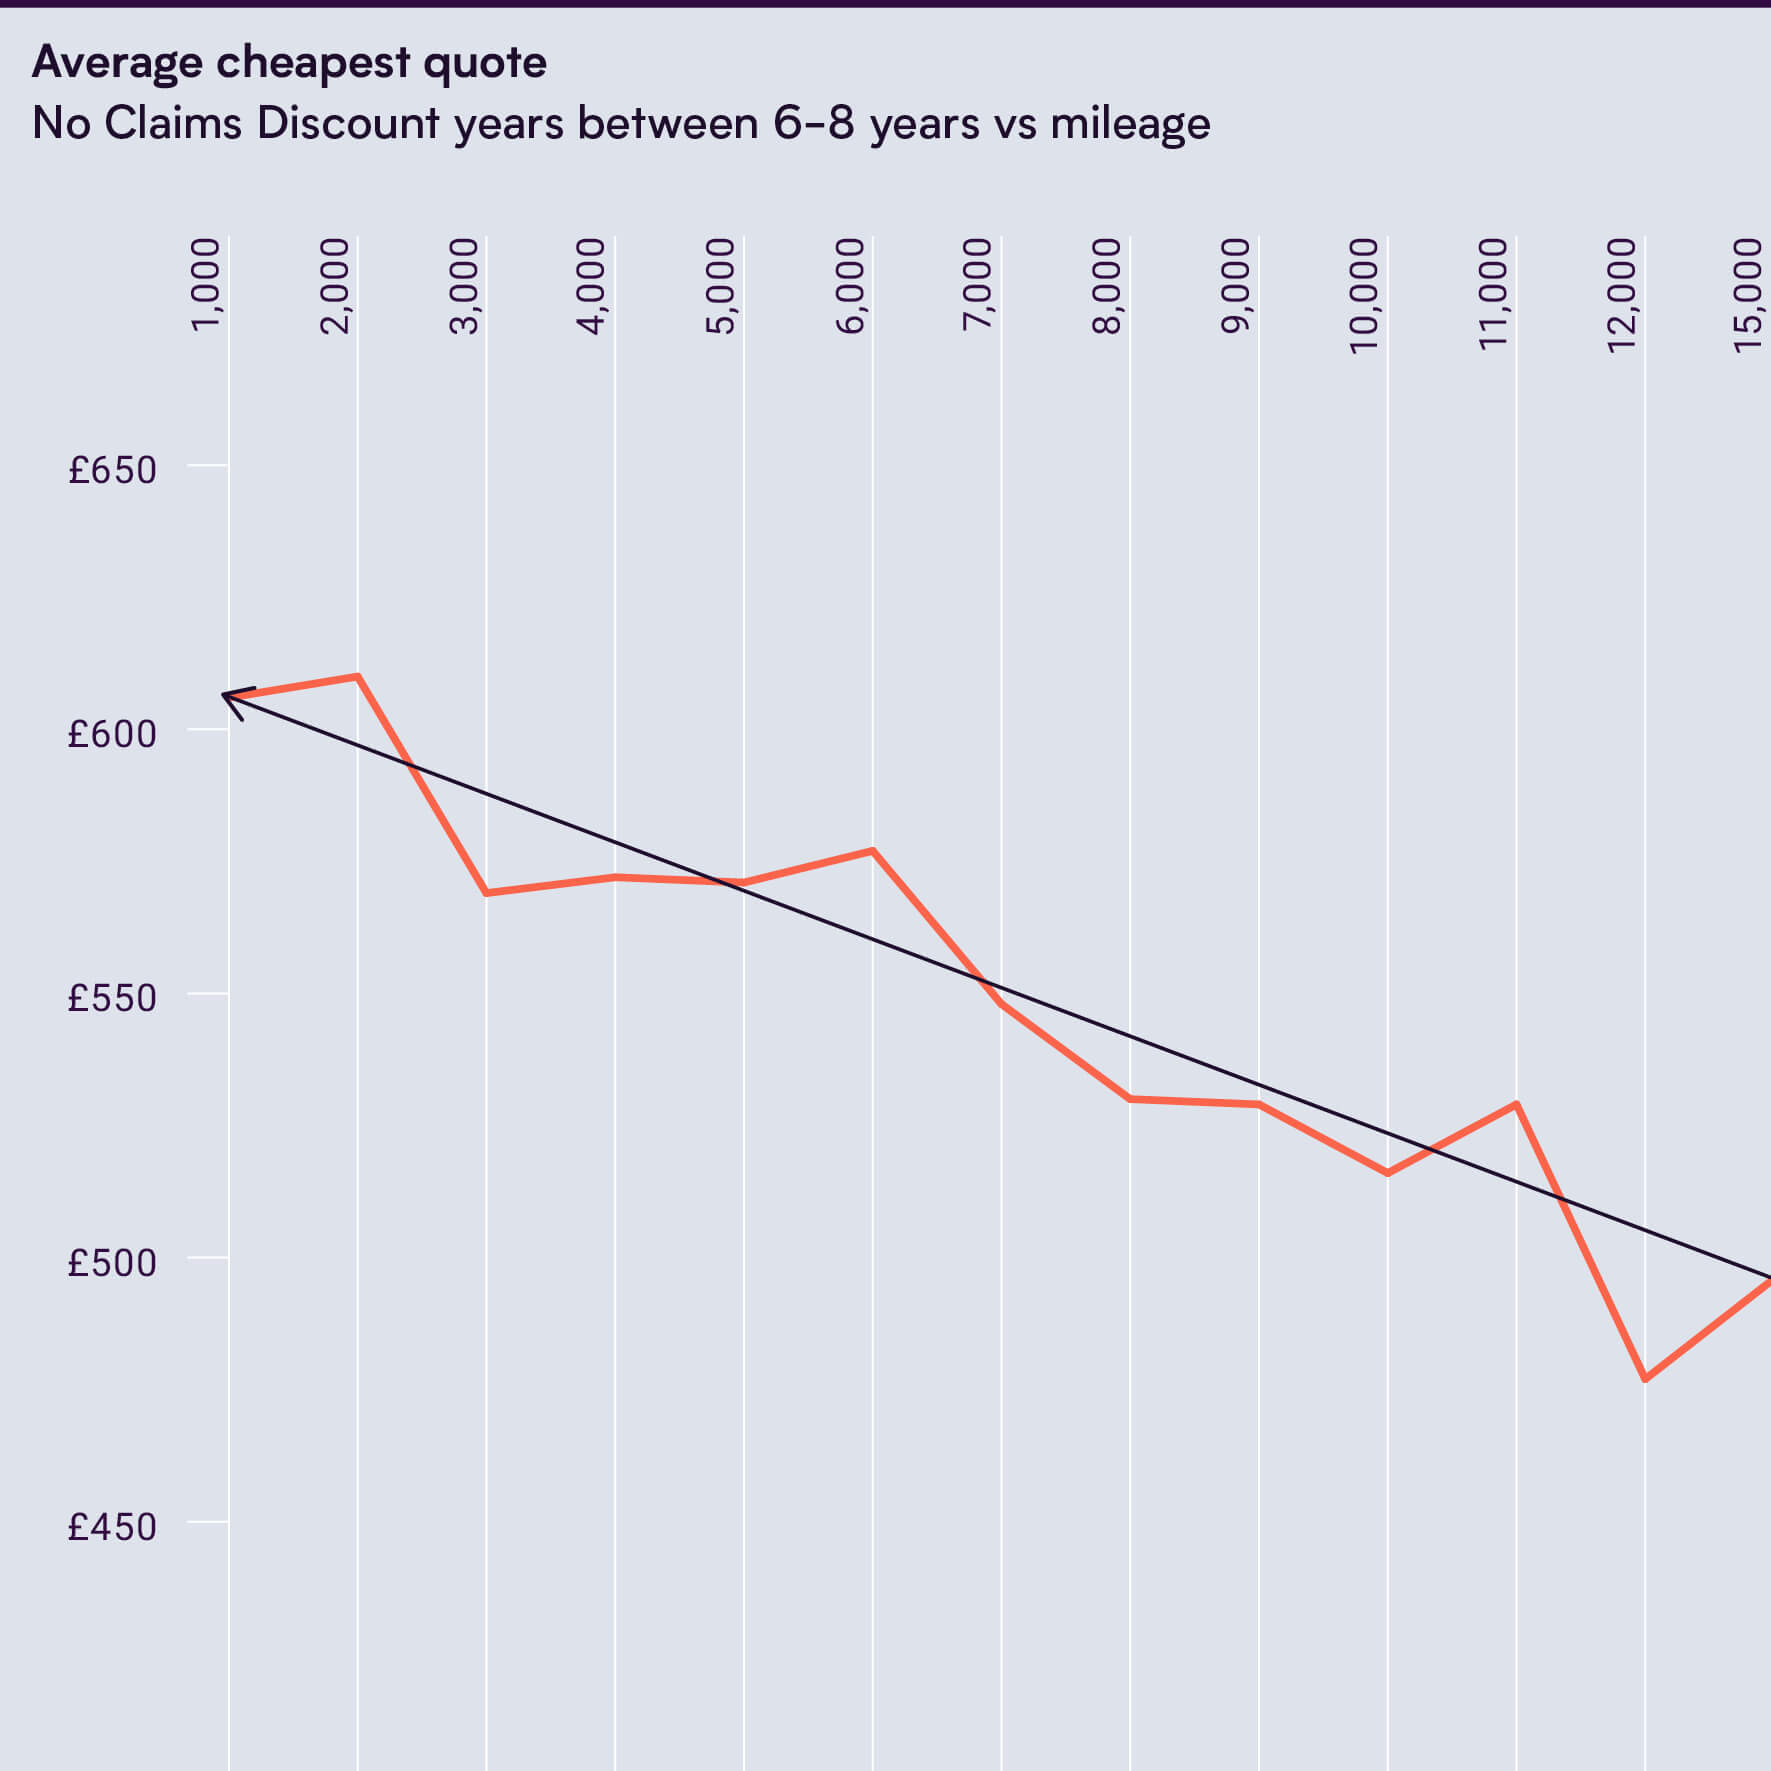
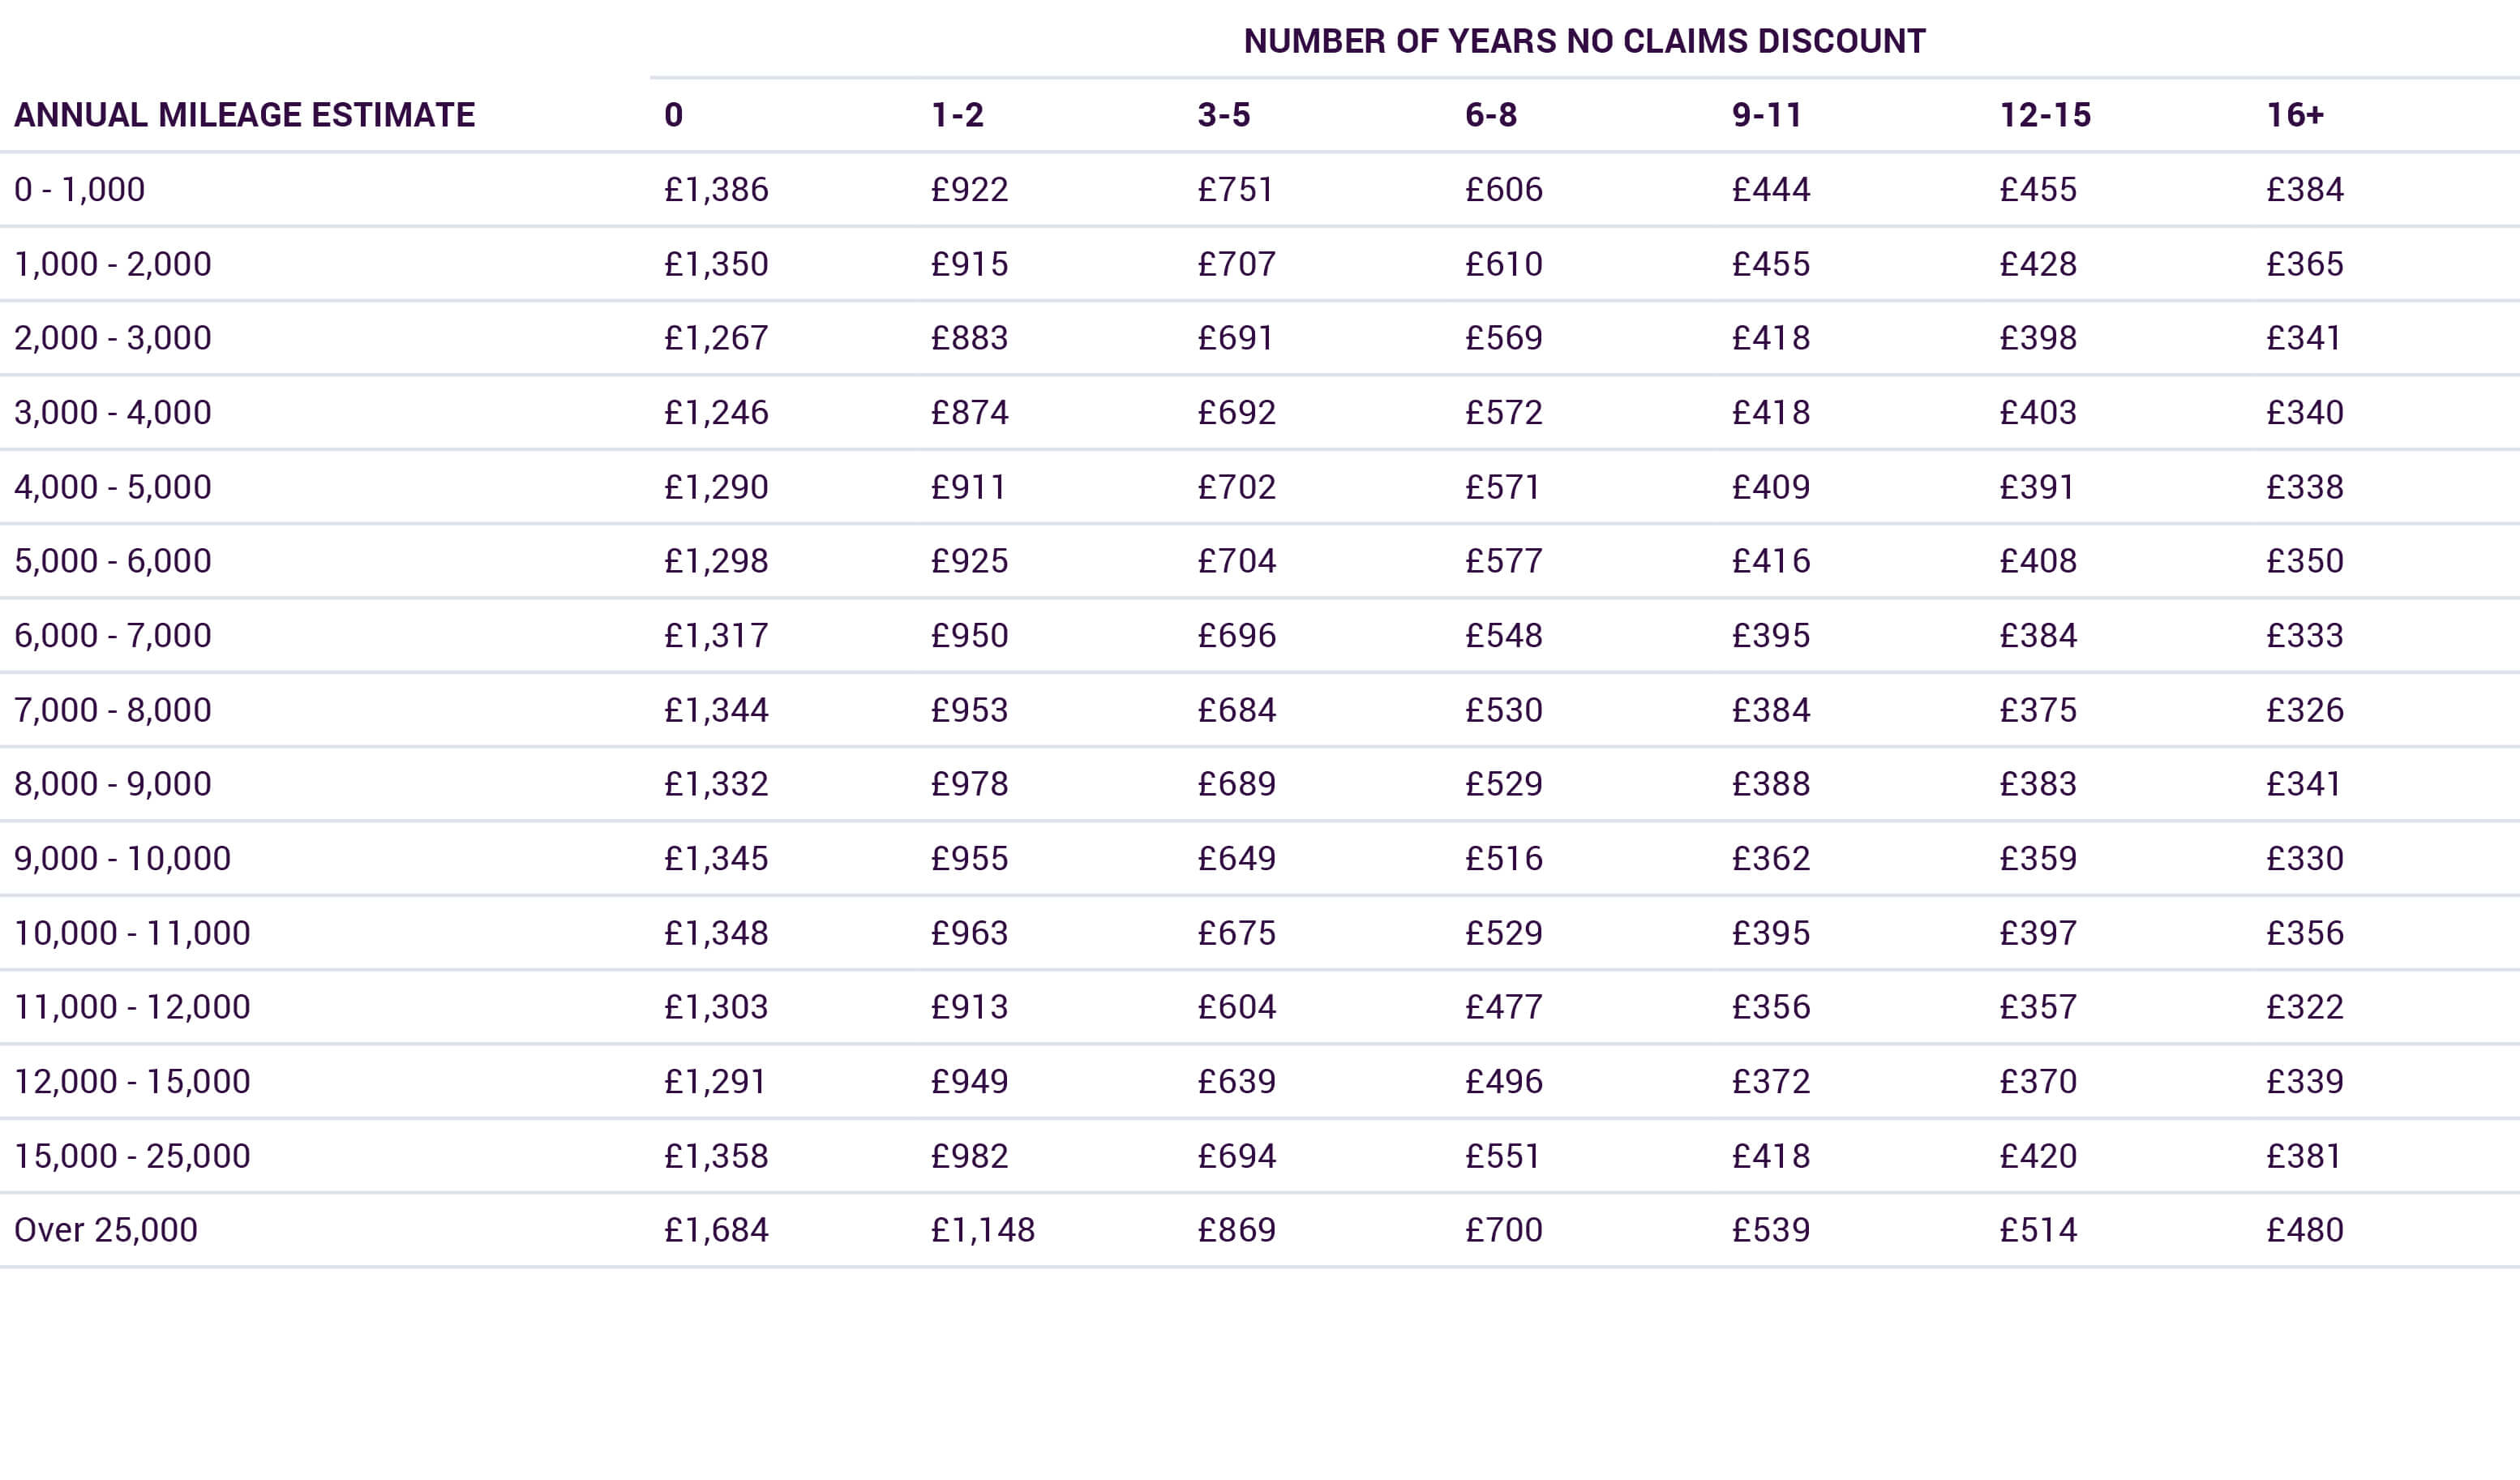
- Insurers don’t seem to be pricing low mileage drivers higher due to lack of experience. Motorists who’ve built up between 6 to 8 years of No Claims Discount and drive 5,000-6,000 miles a year are still charged £100 more than those driving 10,000-11,000 miles a year.
You can download the full report here.
Paying more for driving less.
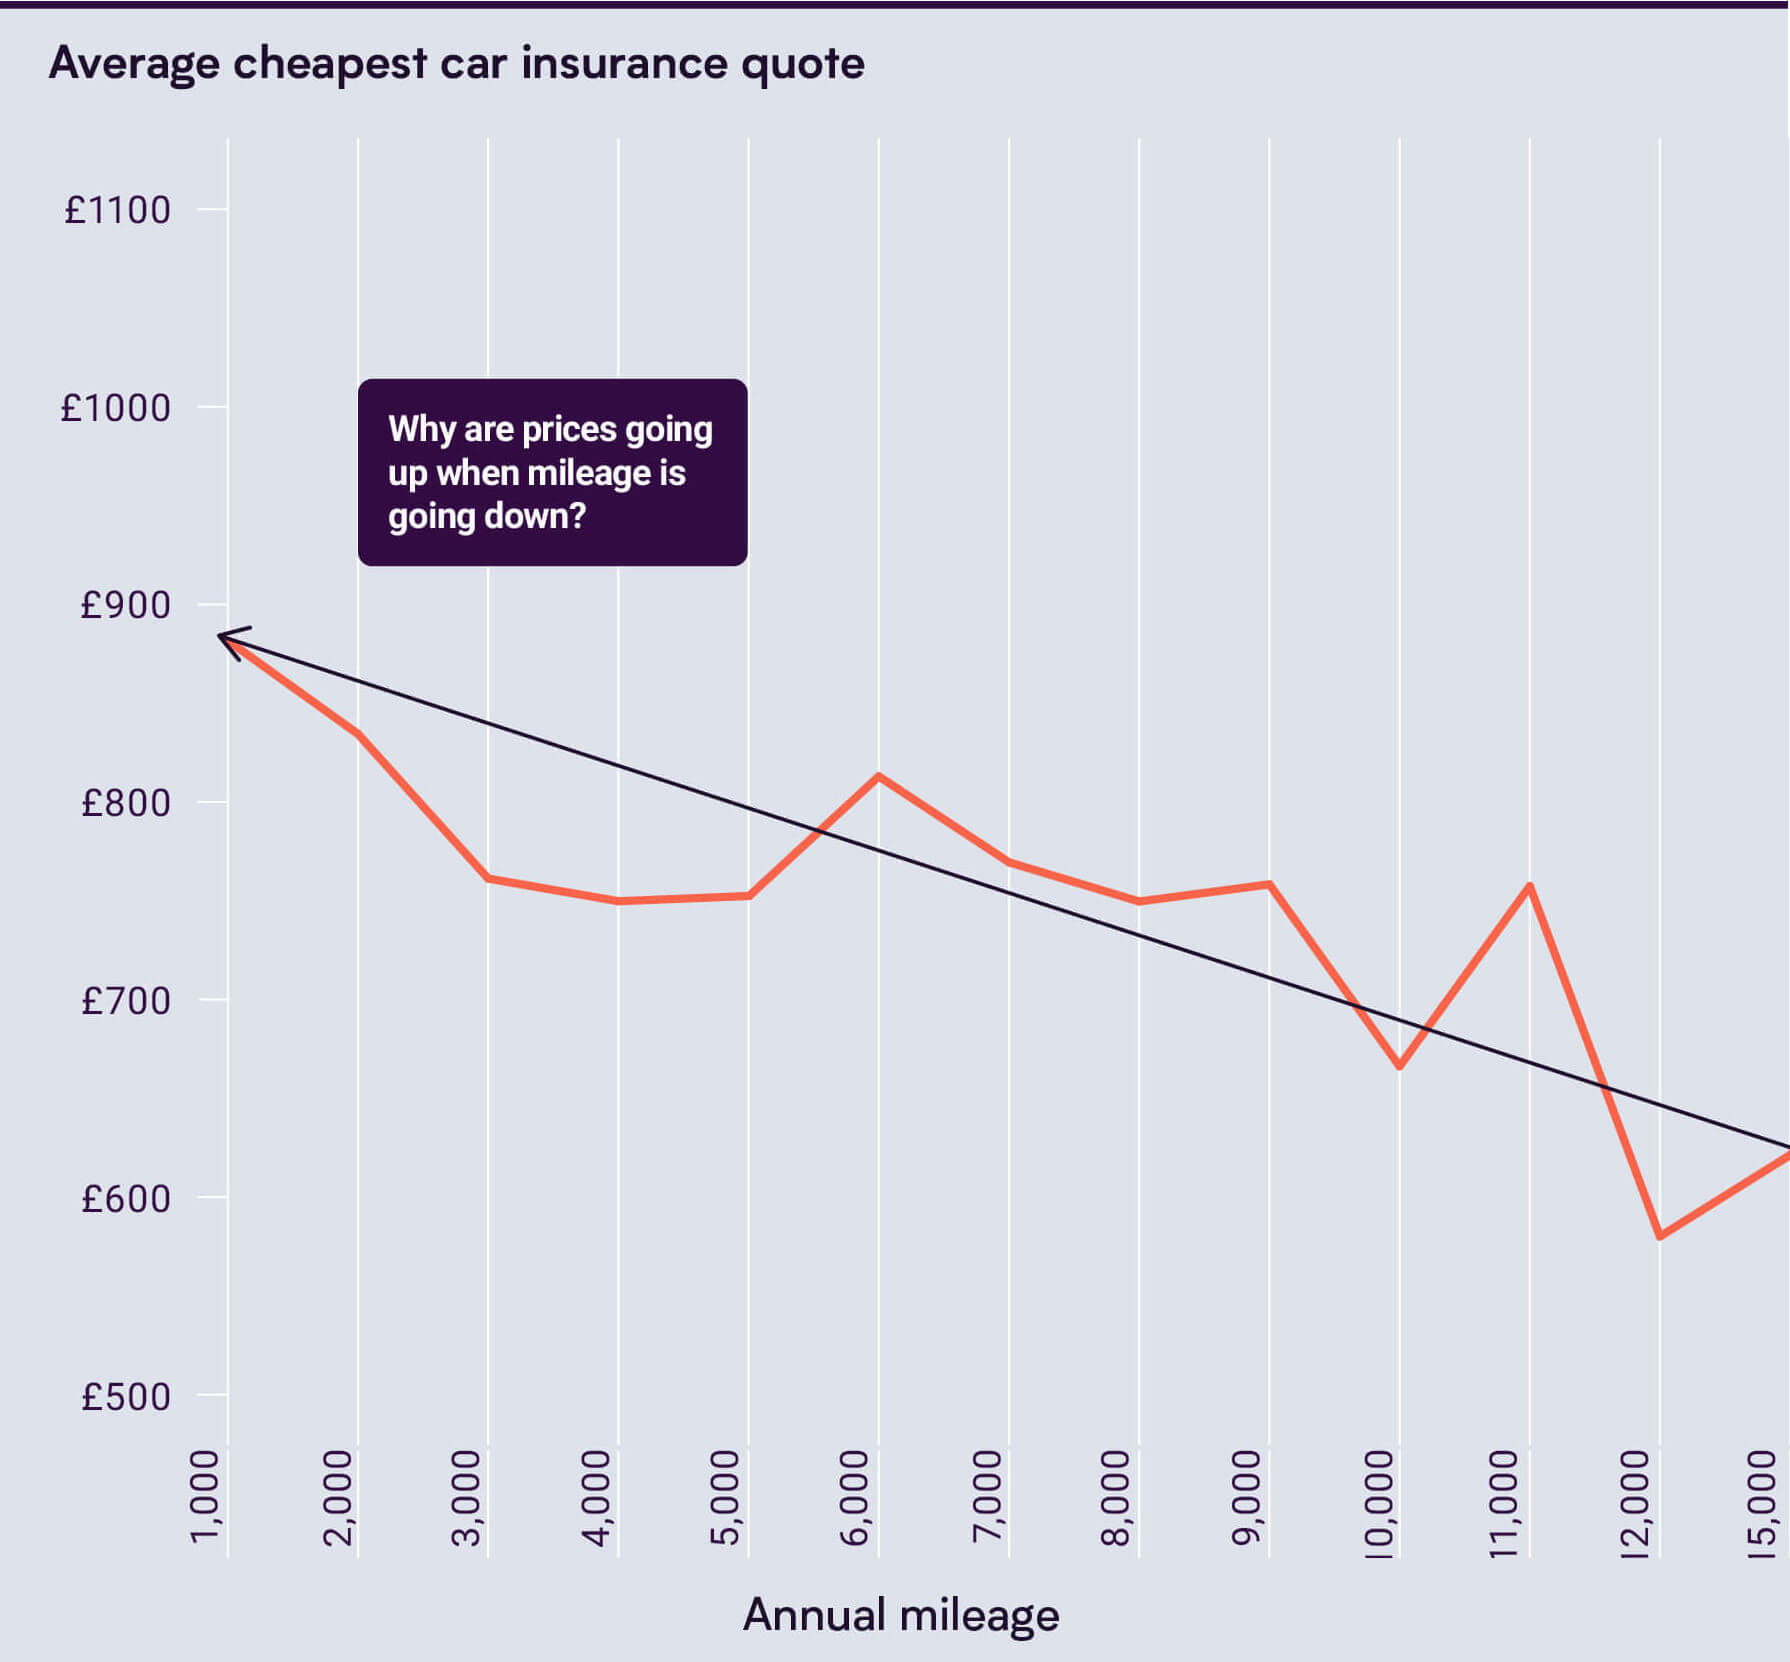
The average low mileage driver is being charged £233 more than a higher mileage motorist.
For a long time, drivers have been led to believe that the price they pay for their car insurance was linked to the miles they drive – and it stands to reason that the less they drive, the less they’d pay.
This analysis shows quite the opposite, with the cheapest car insurance quotes being given to motorists saying they drive 11,000-12,000 miles a year.
How it should look.
It’s not all down to lack of experience.
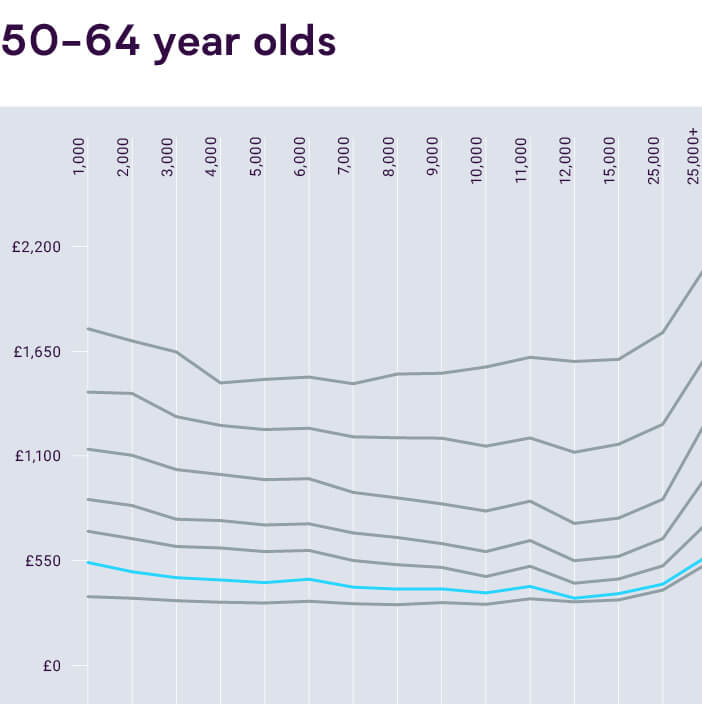
The most experienced drivers are also getting over-charged, with 50 to 64-year-olds driving 5,000 miles a year paying £100 more than those driving 11,000-12,000 miles.
Motorists who’ve built up between 6 to 8 years of No Claims Discount and drive 5,000-6,000 miles a year are still charged £100 more than those driving 10,000-11,000 miles a year.
According to Matt Wood, Head of Pricing at By Miles:
“It stands to reason that less experienced drivers should be charged more, but if someone’s been driving for 20 years, whether they now drive 3,000 miles or 10,000 miles a year is going to have little impact on their driving ability.”
No Claims Discounts show experience, but lower mileage drivers are still penalised.
Experience is already taken into account in insurance pricing in several ways, aside from mileage.
The factors used are:
- How long a driving licence has been held
- Age of the driver(s)
- Years of No Claims Discount
- Number of claims
No Claims Discounts are accrued by drivers for any consecutive years they’ve not claimed on a policy, and as such, these are a good indication of a driver’s record of driving experience and safety on the road.
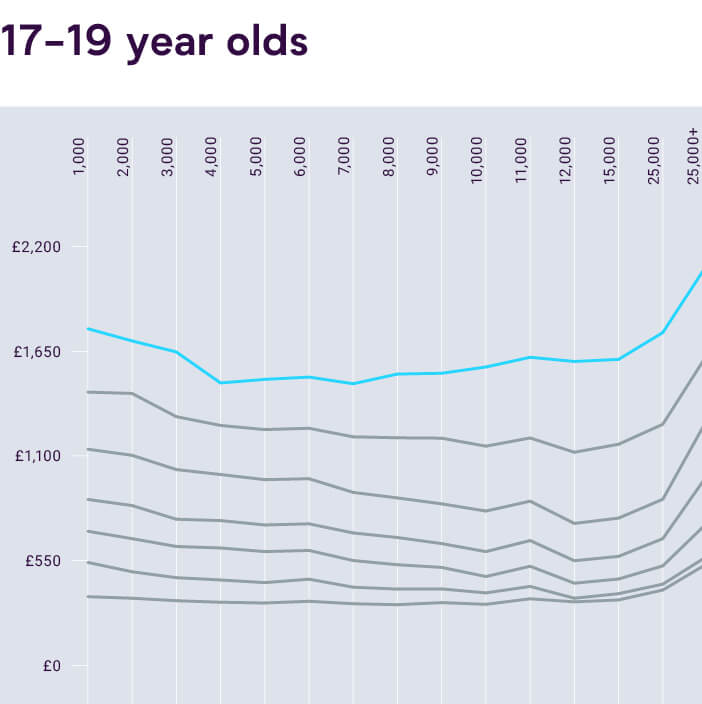
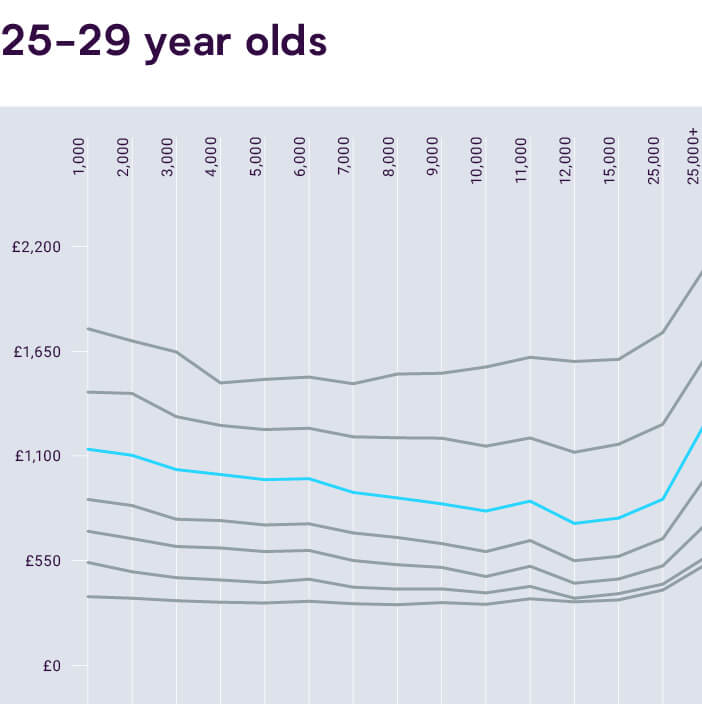
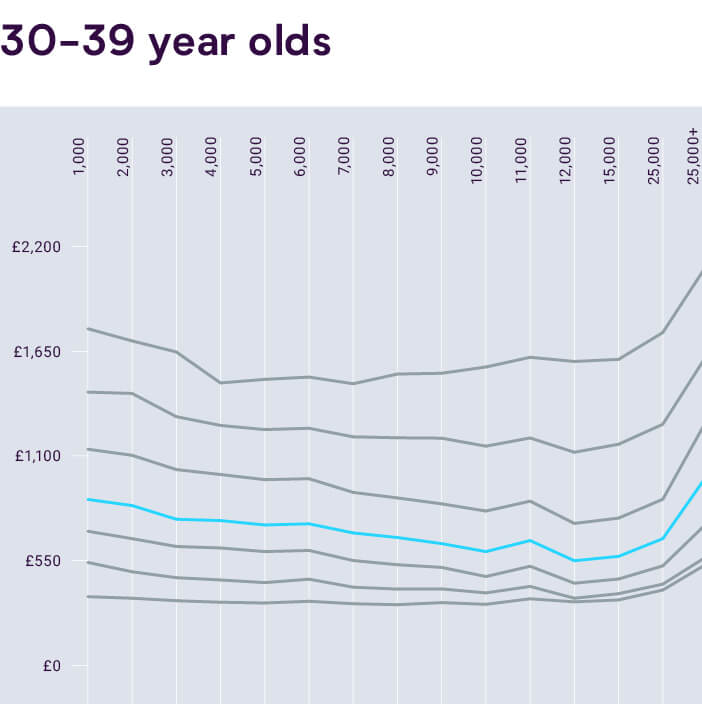
A graph of the cheapest annual car insurance cost by age (indexed to 1 at estimates of 11,000-12,000 miles).
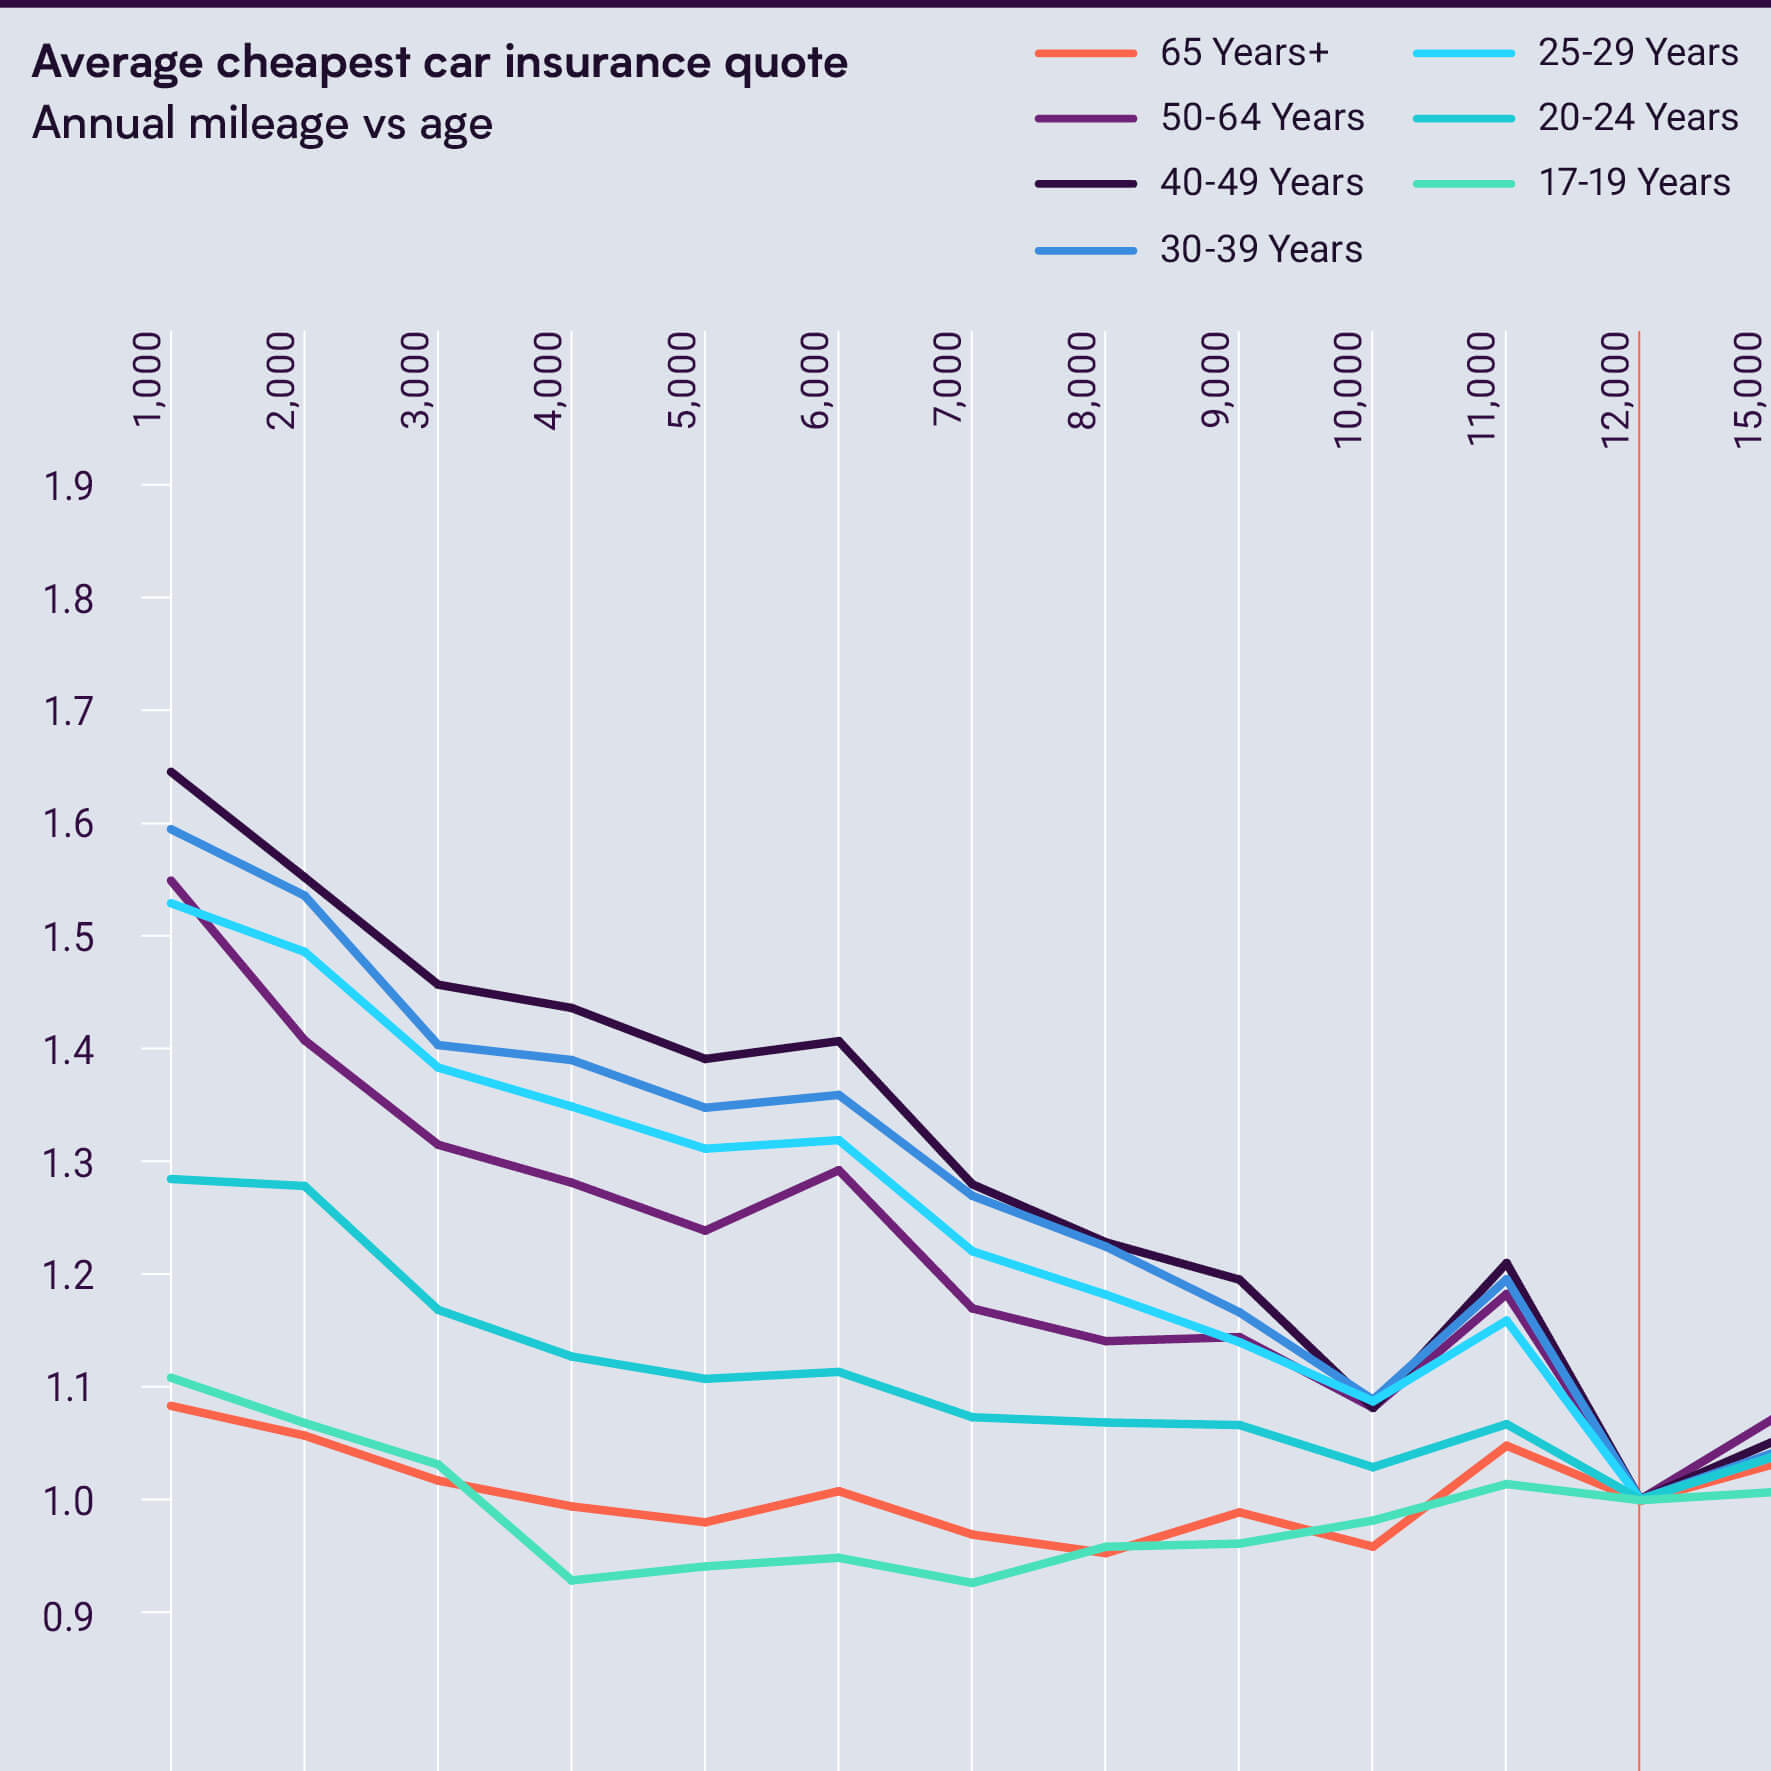
Low mileage drivers of all ages are being stung with higher car insurance quotes.
For the majority of age groups (drivers aged between 20-64), drivers got the cheapest quote when they estimated driving a high mileage of between 11,000 and 12,000 miles a year, with the highest quotes coming in for drivers estimating 25,000+ miles or under 1,000 miles. It is especially surprising to see this effect even in older drivers, who will in general have many years of additional driving experience.
Surprisingly, only drivers with either the least driving or most driving experience (17-19 and 65+ year olds) saw cheaper quotes for lower mileages.
Overall average quote table for all age groups.
While the most common mileage quoted in our analysis was for an annual distance of between 5,000 and 6,000, the cheapest quotes were given to mileages between 11,000 and 12,000, with the lower mileage drivers paying £232.59 higher for their car insurance.
Motorists driving in line with the UK average car’s mileage of 7,134 potentially overpaid by £169.33.
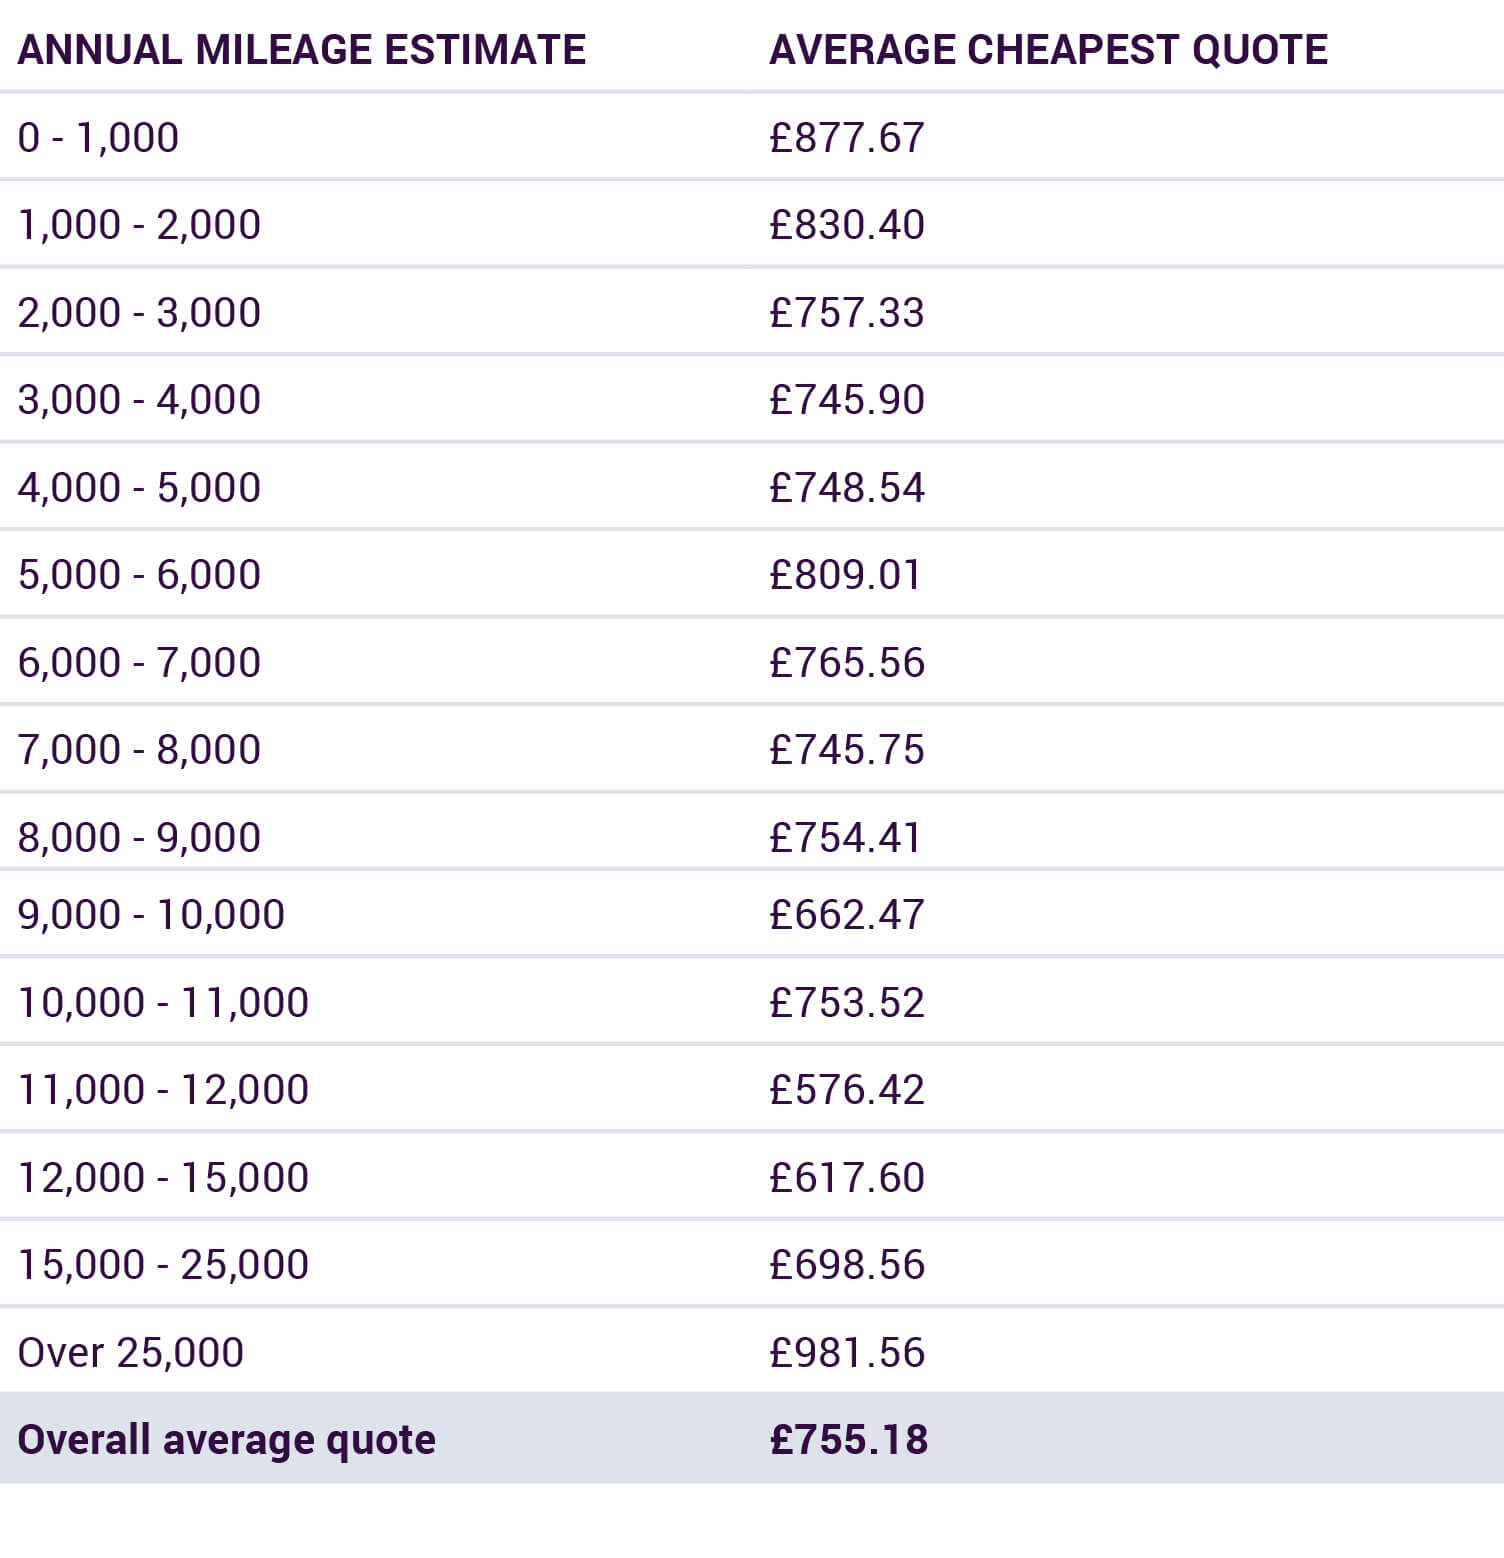
Average cheapest quote.
The cheapest quotes are generally for those that estimate an annual mileage of 12,000 miles, which is over 50% above the UK average.
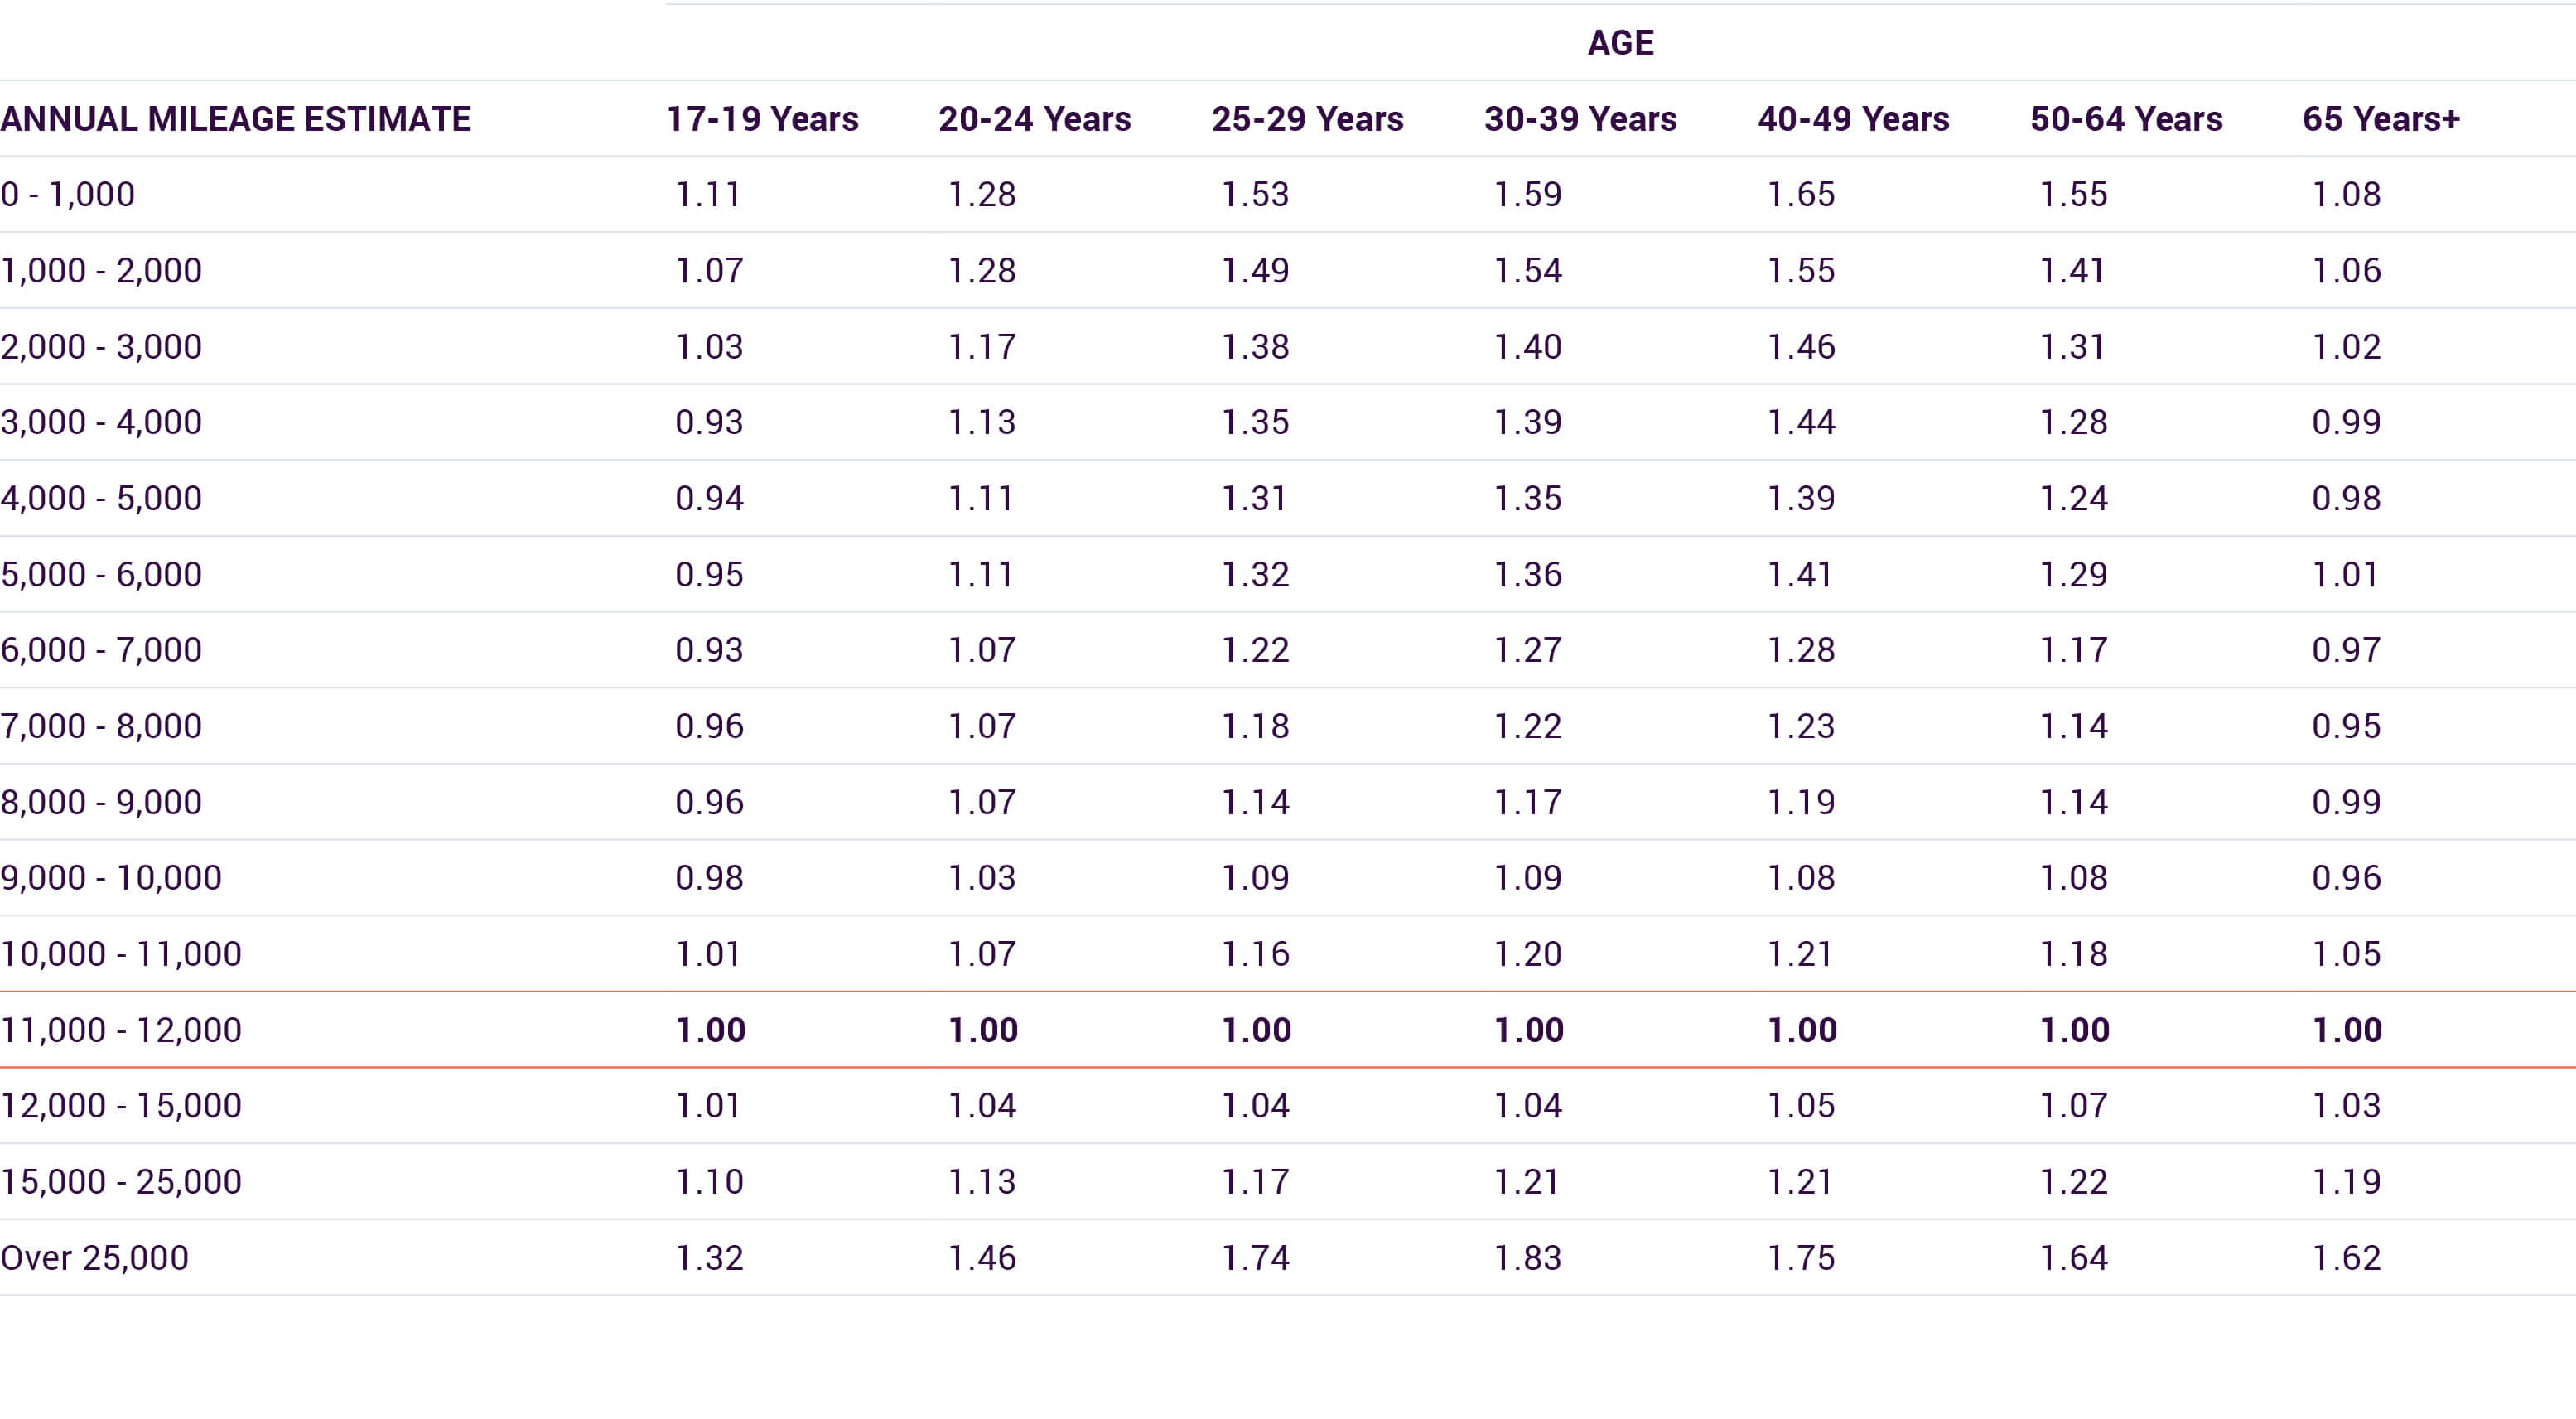
Average cheapest quote table (indexed to 1 at estimates of 11,000-12,000 miles).
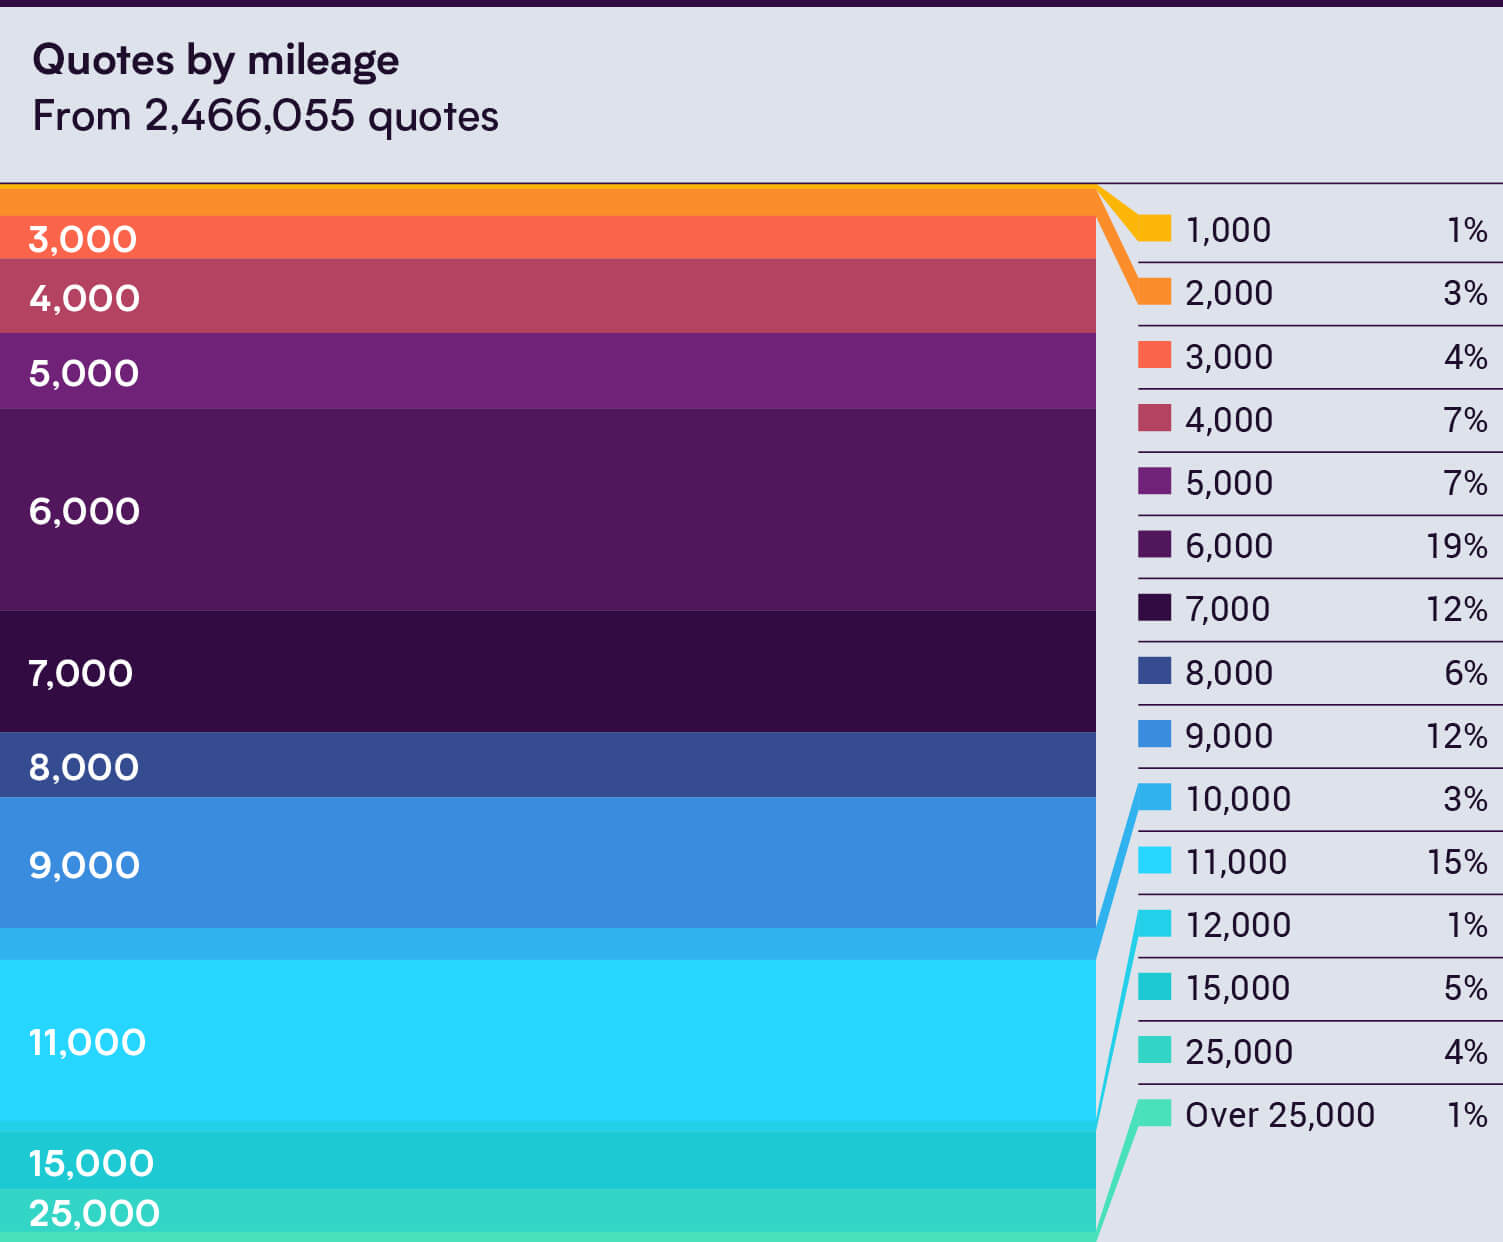
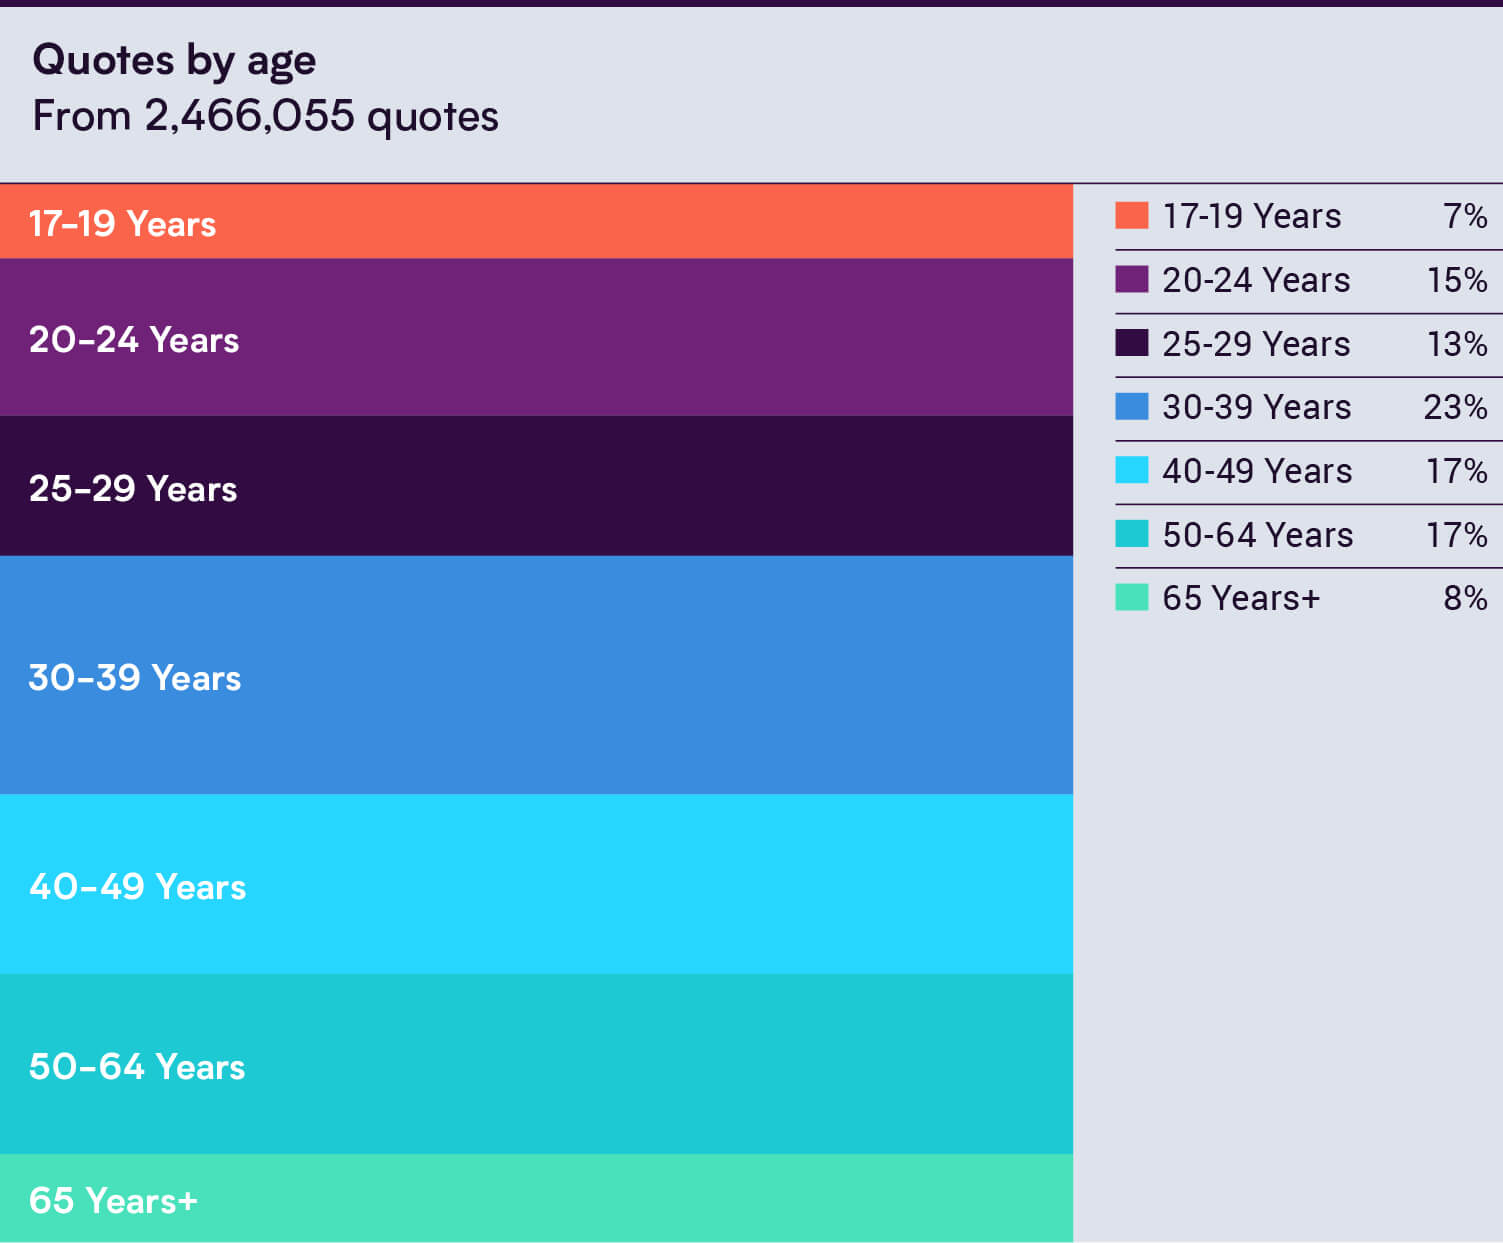
Volume of quotes analysed.
These graphs show the proportional distribution of the 2,466,055 total quotes analysed.
The most commonly declared annual mileage was 5,000-6,000 year (19%), while the most quotes by age group were seen by drivers aged 30-39 (23% of all quotes).
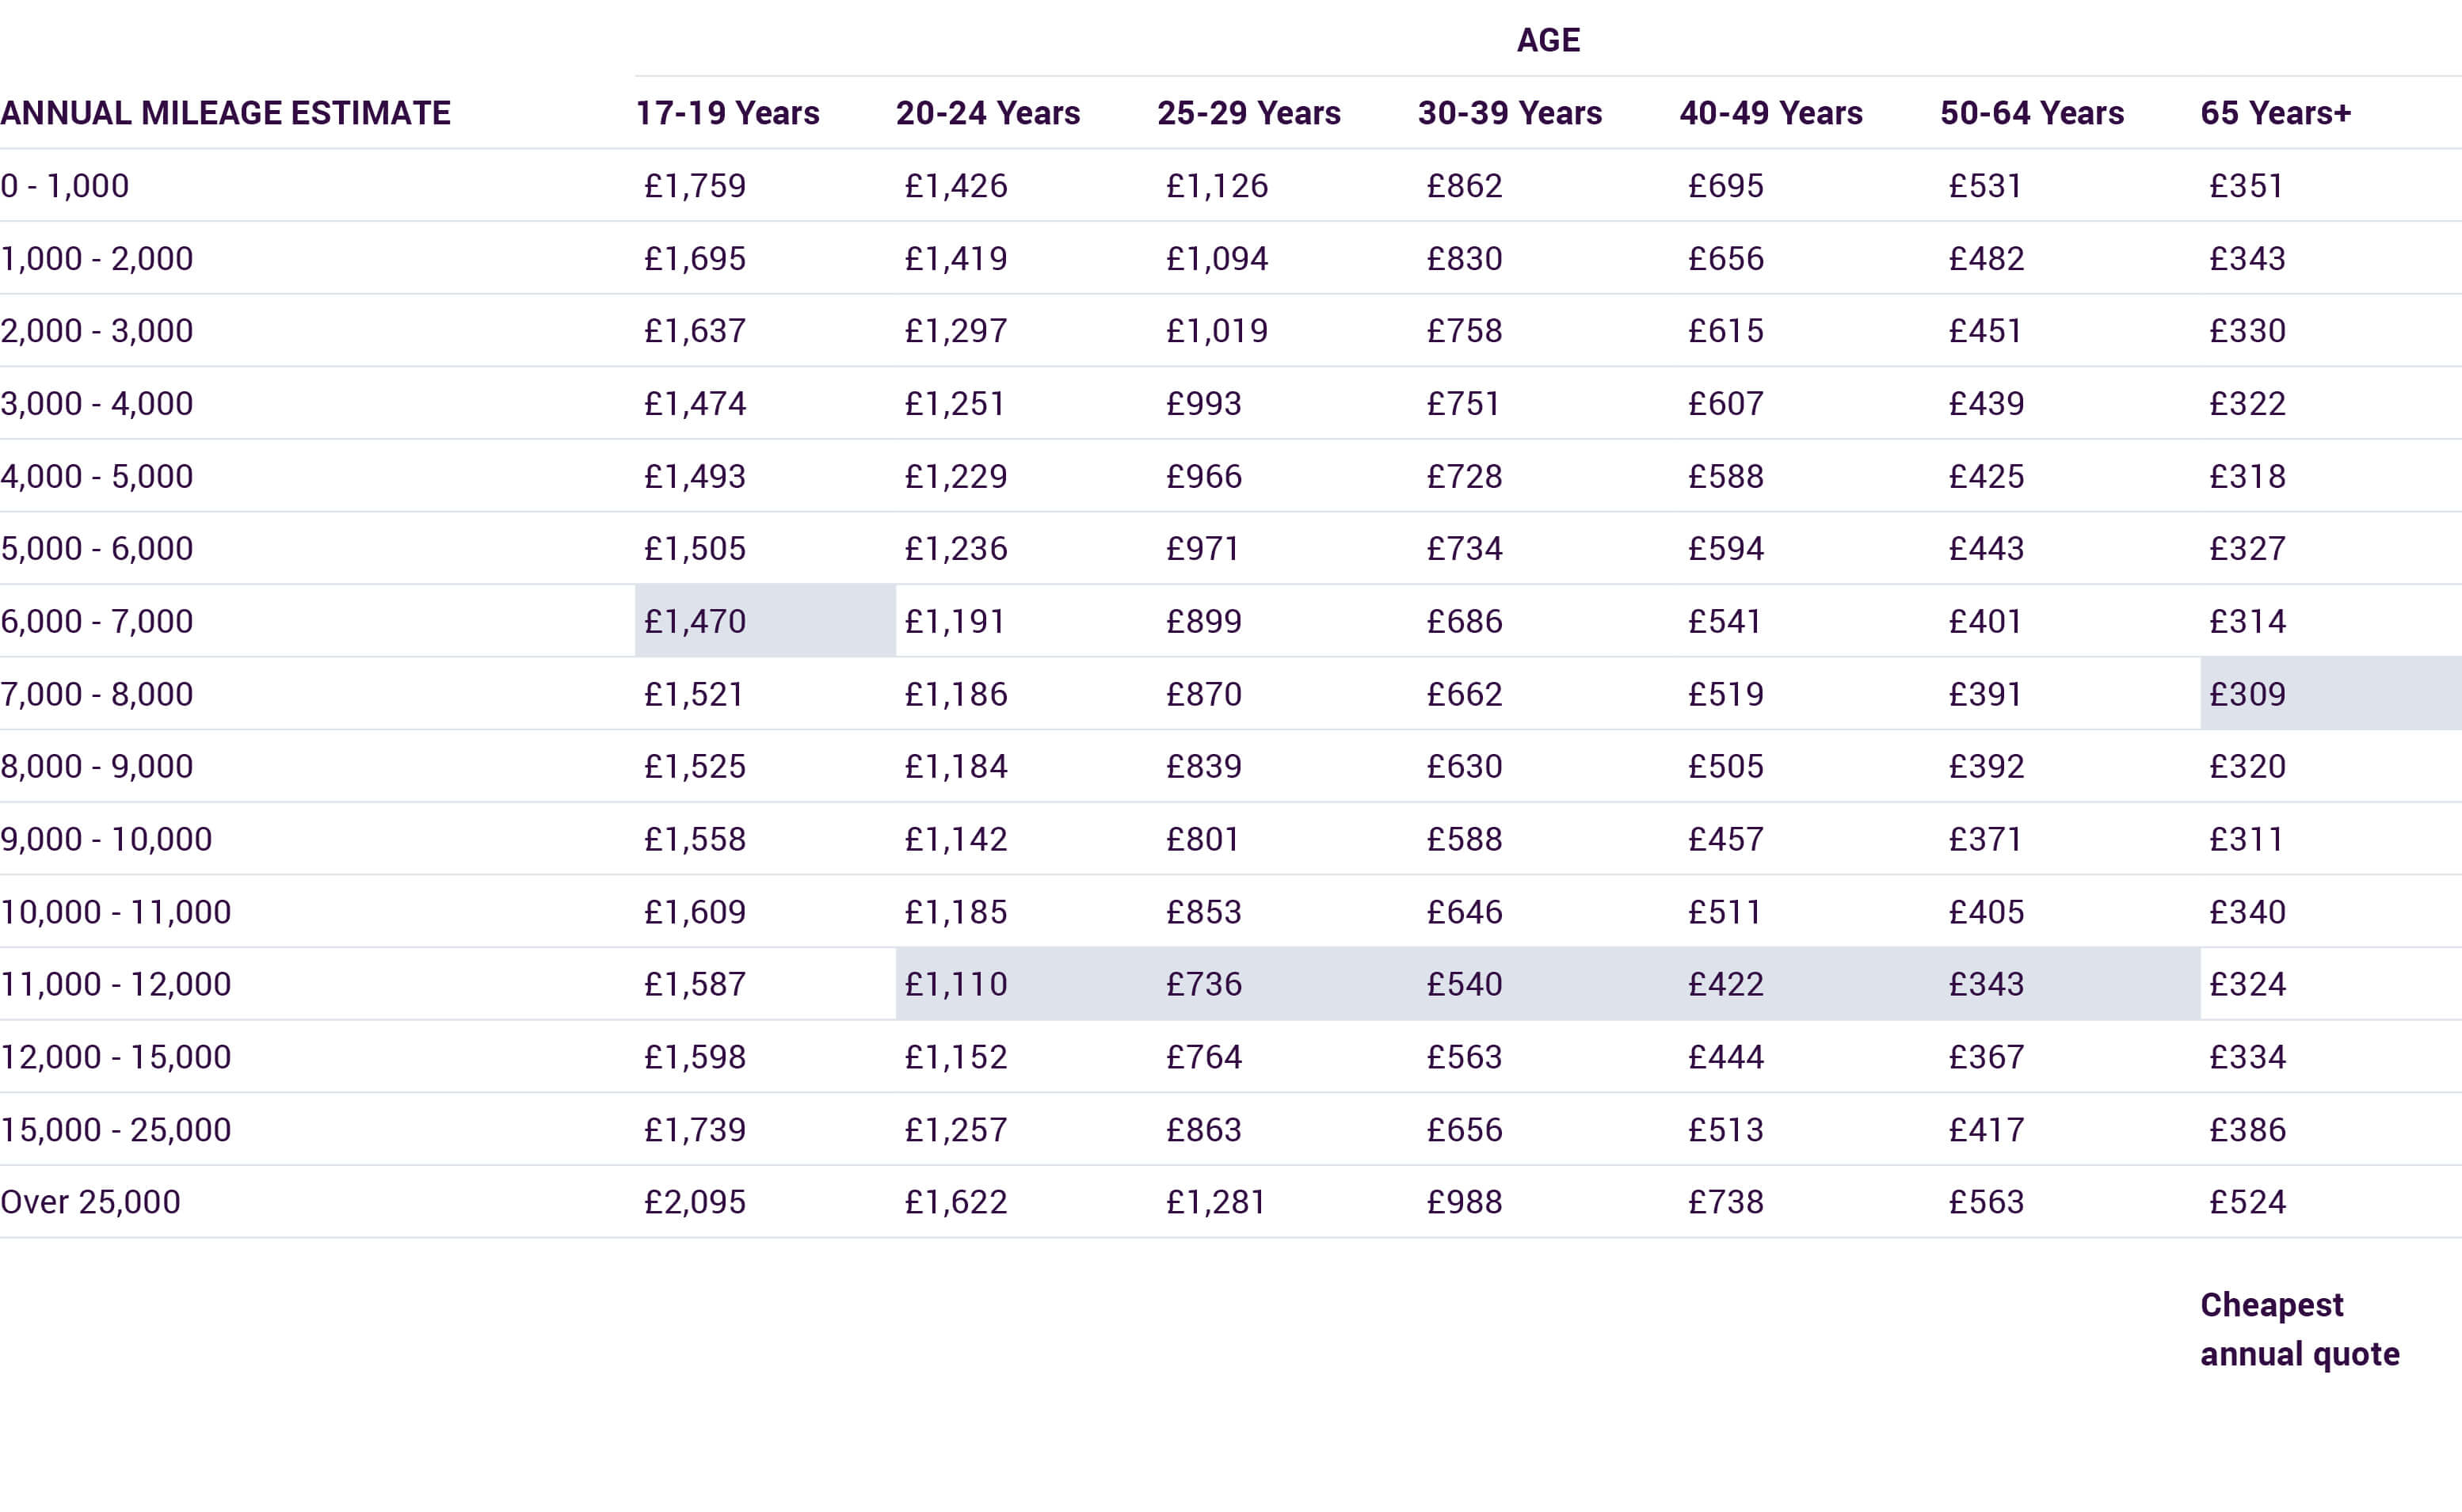
Average car insurance costs by age.
- Best price quote: Between 6,000 – 7,000 miles a year
- Most popular annual mileage: 5,000 – 6,000 (21.31%)
- Highest annual cost: £2,095 (Over 25,000 miles a year)
- Second highest annual cost: £1,759 (Under 1,000 miles a year
- Lowest annual cost: £1,470 (Between 6,000 – 7,000 miles a year)

- Best price quote: Between 11,000 – 12,000 miles a year
- Most popular annual mileage: 5,000 – 6,000 (20.05%)
- Highest annual cost: £1,622 (Over 25,000 miles a year)
- Second highest annual cost: £1,426 (Under 1,000 miles a year)
- Lowest annual cost: £1,110 (Between 11,000 – 12,000 miles a year)
>
- Best price quote: Between 11,000 – 12,000 miles a year
- Most popular annual mileage: 5,000 – 6,000 (20.77%)
- Highest annual cost: £1,281 (Over 25,000 miles a year)
- Second highest annual cost: £1,126 (Under 1,000 miles a year)
- Lowest annual cost: £736 (Between 11,000 – 12,000 miles a year)
- Best price quote: Between 11,000 – 12,000 miles a year
- Most popular annual mileage: 5,000 – 6,000 (19.84%)
- Highest annual cost: £988 (Over 25,000 miles a year)
- Second highest annual cost: £862 (Under 1,000 miles a year)
- Lowest annual cost: £540 (Between 11,000 – 12,000 miles a year)

- Best price quote: Between 11,000 – 12,000 miles a year
- Most popular annual mileage: 5,000 – 6,000 (17.51%)
- Highest annual cost: £738 (Over 25,000 miles a year)
- Second highest annual cost: £695 (Under 1,000 miles a year)
- Lowest annual cost: £422 (Between 11,000 – 12,000 miles a year)
- Best price quote: Between 11,000 – 12,000 miles a year
- Most popular annual mileage: 5,000 – 6,000 (16.65%)
- Highest annual cost: £563 (Over 25,000 miles a year)
- Second highest annual cost: £531 (Under 1,000 miles a year)
- Lowest annual cost: £343 (Between 11,000 – 12,000 miles a year)

- Best price quote: Between 7,000 – 8,000 miles a year
- Most popular annual mileage: 5,000 – 6,000 (18.84%)
- Highest annual cost: £524 (Over 25,000 miles a year)
- Second highest annual cost: £386 (Between 15,000 – 25,000 miles a year)
- Lowest annual cost: £309 (Between 7,000 – 8,000 miles a year)
Average cheapest quote by No Claims Discount.
Where did the data come from?
Methodology.
1) Data based on 2,466,055 customer quotes from car insurance companies on MoneySuperMarket.
2) Data period: 1 Jul 2018 to 30 Sep 2018.
3) Prices shown are the average price of the cheapest car insurance quotes returned for each age and annual mileage group.
4) Excludes:
a. Duplicates (one enquiry per MoneySuperMarket customer email address)
b. Outliers
c. People on provisional licences.
Note: In all cases, whether referred to as the ‘average price’, ‘average quote’ or otherwise, prices shown in this report are the average price of the cheapest car insurance quotes returned for that age and annual mileage group.
Sources
1) Data based on 2,466,055 customer quotes from car insurance companies on MoneySuperMarket run between 1 Jul 2018 to 30 Sep 2018. Prices shown are the average price of the cheapest car insurance quotes returned for each age and annual mileage group. Source
2) 31.6 million cars licensed in the UK as of Sep 2018, according to the Department for Transport. Source
3) 8,755,173 out of 14,503,248 cars drove less than 7,134 miles per year (60.4% of all UK cars). UK average of 7,134 miles a year in 2017, according to the latest MoT data from the Department for Transport. Cars less than three years old not are not included in the MOT data. Source
4) 60.4% of 31,600,000 cars is 19,086,400 cars. This suggests 19 million drivers are in danger of being over-charged for car insurance, according to analysis of the data above. Source
About the authors.
About By Miles.
By Miles is a UK startup that provides pay-as-you-drive car insurance to those who drive fewer than 7,000 miles a year. Drivers pay a small upfront sum for an annual policy and are then billed at the end of each month for the miles they drive. This offers many drivers the opportunity to cut their bills if they mostly use their cars for regular short trips or at weekends.
As of 31st January 2019, we were rated 9.7 on Trustpilot and had been given Defaqto’s top rating of 5 Stars. By Miles is authorised and regulated by the Financial Conduct Authority.
About MoneySuperMarket.
MoneySuperMarket is the UK’s leading price comparison website. They provide free, online tools to help people manage, save and grow their money, by enabling them to compare and switch Insurance, Money and Home Services products from more than 980 providers across 44 different channels.
MoneySuperMarket is part of the Moneysupermarket Group PLC, an established member of the FTSE 250 index. In 2017, they helped nearly eight million families save an estimated £2bn on their household bills, including five million people who saved money on their insurance, two million who got a better deal on their finances and over half a million households that switched their energy supplier.
Moneysupermarket.com Limited is an appointed representative of Moneysupermarket.com Financial Group Limited, which is authorised and regulated by the Financial Conduct Authority (FCA FRN 303190) for the insurance, mortgage and consumer credit products it offers.For energy products, MoneySuperMarket is accredited under the Ofgem Confidence Code.


