Now that the nation’s MOT data for 2022 is out, we’ve been taking a look at the numbers. Read on and find out which makes and models are statistically most reliable, when it’s best to take your test – and what’s going on with our overall driving habits.
Contents.
Low mileage is the new normal.
Does lower mileage make driving cheaper.
Pass rates.
Mileage by fuel types.
The best time to book your MOT.
The most (and least) successful colours.
The best (and worst) makes and models.
Lower mileage is the new normal.
It’d be easy to say that it was the pandemic that turned the UK into a nation of lower mileage drivers. But if we zoom out a little, we can see that’s not really true.
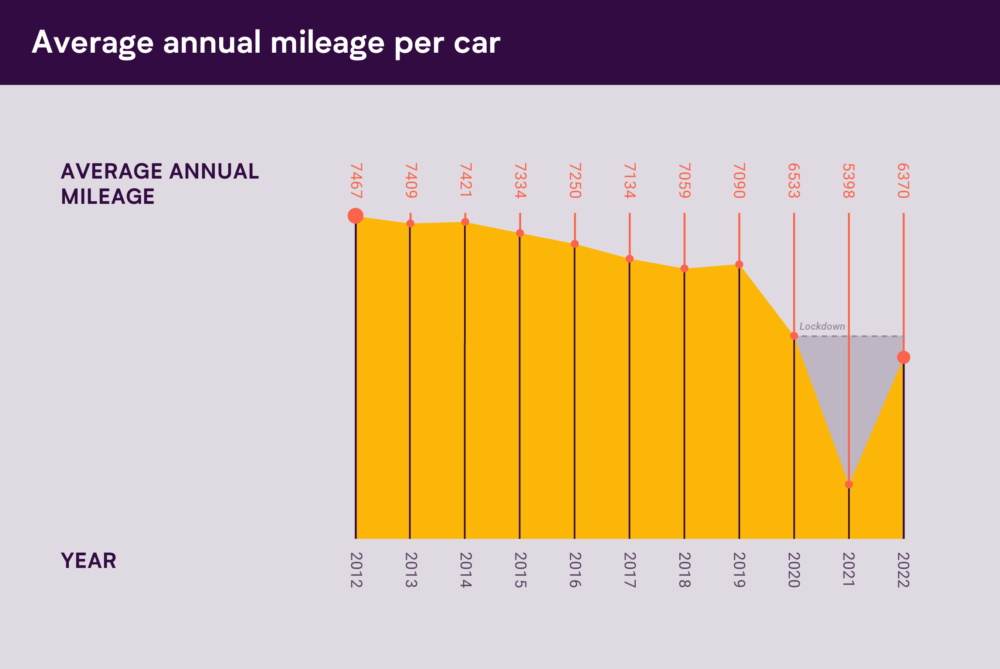
From 2010 to 2018, our average annual mileage fell by 500 miles – down to 7059. So, even before Covid came along people had generally been driving less and less for a decade already.
Of course, lockdowns of 2021 and 2022 had a big impact on the nation’s driving habits (as you can see from the dip in the graph below). But in 2022, none of those restrictions applied. You might have thought that would lead to a big jump in mileage, with folks going back to their pre-pandemic driving habits. But that’s not how it’s gone.
The downward curve continues.
Average mileage for 2022 is up from the incredible low of 2021. But as you can see, it’s still in keeping with the overall trend of falling mileage.
In 2022, the UK’s average mileage was 6,370. That’s 720 miles less than in 2019 – the last year where there were no lockdowns to skew the comparison. (In fact, it’s still less than in 2020, when there were lockdowns!)
Two years on, the nation is still driving less than we did during lockdown.
Looking back 10 years, we see that average annual mileage has fallen by a whopping 1,097 since 1012.
Of course, there’s more than one way to figure out an average. The ‘mean’ mileage is 6,370 per a year. But that number is impacted by the small number of people who drive huge amounts each year.
Looking at the modal average is a good way to ignore outliers – and shows how normal lower mileage lifestyles have become.
The most common mileage bracket for Britain’s drivers is now just 3,000 – 4,000 miles a year.
All that just goes to show not just how much our driving habits have changed – but that the change seems to be here to stay. Why is that?
Well, there’s been a huge rise in working from home. A lot of companies (us included!) switched to hybrid working, loved the benefits and never went back.
On top of that, people have gotten used to buying all kinds of things online that they might have driven out to buy before.
Finally, there’s the ongoing cost of living crisis. With everyone looking to make their money go further, a lot of people have cut out back on driving to save money. (On that topic, check out the cost of living episode of Driving Change below).
Does a lower mileage make driving cheaper?
It makes straightforward sense that the less you drive, the less it should cost you. It’s true for petrol. It’ll be true for maintenance (unless you’re really unlucky). So what about car insurance?
We didn’t think that was fair, which is why we launched our pioneering pay-by-mile policies. In the last 5 years, we’ve covered over 500 million miles of driving, helping lower mileage drivers all over the country save on their cover.
But what is a lower mileage driver? When we started out, average mileage was around the 7,000 mile mark. Our pricing has always been geared toward helping as many people as possible who drive less than that to get a better deal. These days, that bracket includes 64% of the country. If that’s you, why not a quote?
Right then. What else have we learnt from the new MOT data?
Find out how the nation’s cars fared in their 2022 MOTs.
Pass rates are up a fair bit.
The overall MOT pass rate was up from 2021, rising from 75.6% to 78.1%. With lockdowns now completely over, it’s possible that people were putting a little more thought into keeping their cars in decent shape.
…but not so much for newer cars.
Looking specifically at newer cars (aged 3-5 years) pass rates were up too – by a massive 0.1%. They rose from 89.3% to 89.4%.
A lot of the nation’s miles are done by electric and hybrid cars.
As you can see below, the mileage you’re likely to be doing varies a lot depending on the kind of car you have. The average annual mileage for petrol cars is just 5,121. Meanwhile, the numbers are higher for many cleaner fuel types. So why is that?
Diesel vehicles seem to do a lot miles, but does numbers are probably down to haulage.
Fuel type
Average annual mileage
Electric Diesel
9559
Gas
9471
Gas Diesel
8869
Gas Bi-Fuel
8687
Hybrid Electric (Clean)
8282
Steam
8031
Diesel
7777
LPG
7447
Fuel Cells
6960
Other
6939
Electric
6534
Petrol
5121
CNG
4943
LNG
4311
Pass rates increase over the week.
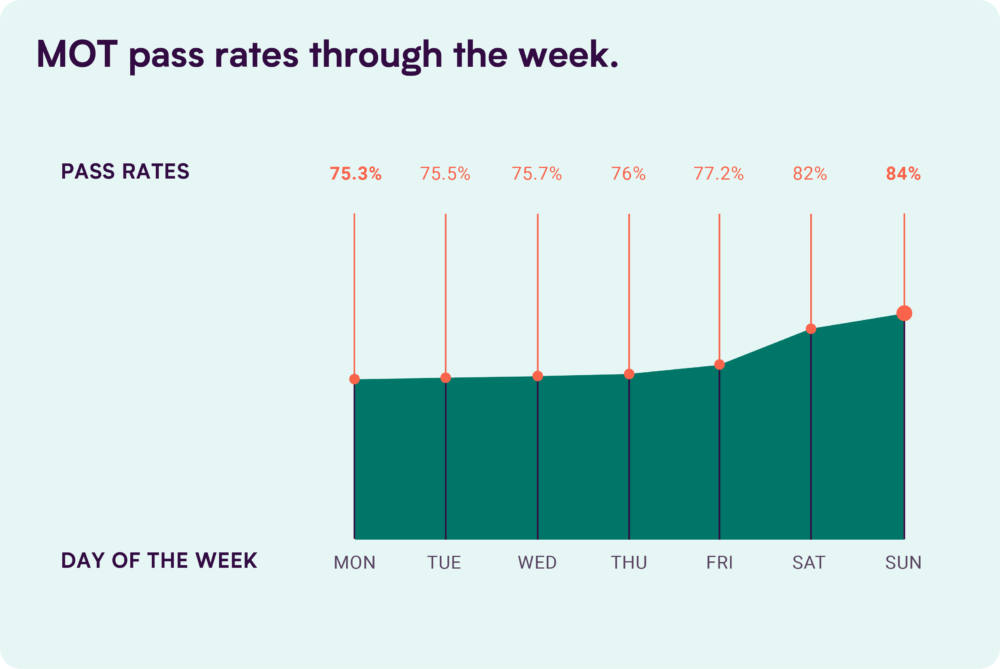
Last time we dived into the data, we found that pass rates go up over the week – and the same was true again in 2022.
The pass rate was 75% on Mondays, gradually creeping up before peaking at 84% on Sunday.
That 9% difference is significant. So Sunday isn’t just the best for wolfing down a nice roast – it’s also the best day to book you MOT.
MOT pass rates get a boost when the weekend comes. Maybe you can relate?
(Psst. Not sure when you need to book your MOT by? Don’t panic – just use our checker.)
Summers sees a seasonal boost.
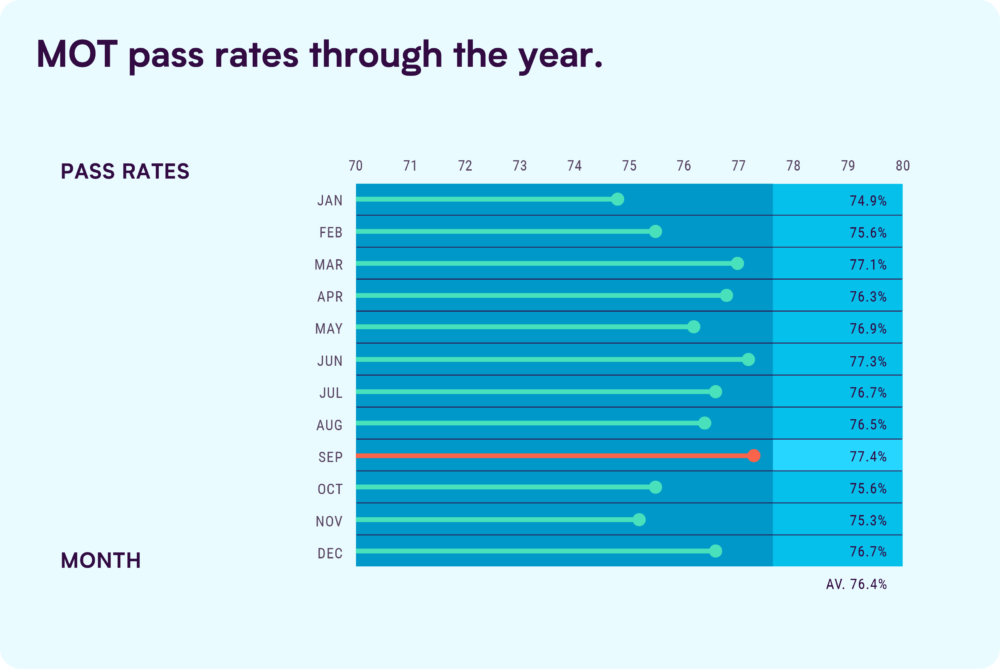
As a general rule, the warmer the weather, the better your chances of getting through your MOT. In the Winter, pass rates hover around 75% – whereas they’re up around 77% during the milder months.
June and September saw pass rates of 77.3 and 77.4% respectively. At the other end of the spectrum, in January and November only 74.9% and 75.3% of cars passed.
So while you’re booking things to do this summer, put your MOT in the diary before that mini break.
Generally speaking, warmer months are kinder when it comes to MOT pass rates.
A Christmas miracle? Probably not.
On 25th December 2022, 96.3% of cars tested passed their MOT – the highest daily rate of the year.
Was that down to Santa spreading good cheer to the nation’s test centres? Perhaps his elves were helping out fixing the odd problem here and there before the examiners saw? Or it just might be because there were only 27 tests done nationwide rather than the usual thousands. Who can really say?
Make some noise for turquoise.
In previous years, it’s been a battle between turquoise and bronze for the colour with the best pass rate. Turquoise won in 2020, but in 2021 bronze took gold (confusingly) – squeezing into top spot by just 0.01%.
This time round, turquoise has reclaimed the crown with a pass rate of 92.4%. (Here’s hoping that comes up for you at the pub quiz.)
Turquoise cars tend to pass with flying colours.
Multi-coloured cars did worst with an 86.7% pass rate. It probably doesn’t take too much imagination to figure out why that might be…
The top 5 manufacturers are mostly Japanese.
Looking at cars in the 3-5 year old range, we see 80% of the list are from the land of the rising sun. The only change from the previous year’s data is that Porsche – the only European brand in the list – has edged above Honda.
2021
2022
Make
Pass rate (%)
Make
Pass rate (%)
Lexus
94.7
Lexus
95.3
Honda
94.1
Porsche
94.4
Porsche
94
Honda
94
Toyota
92.3
Toyota
92.1
Suzuki
92.3
Suzuki
92.1
…and it’s the same for the top 5 models.
In 2021, Honda had the 3 most reliable models in the 3-5 year category. In 2022, that top 3 is completely unchanged. There’s another Japanese model in 4th, and the top 5 is rounded out by a newcomer – the Skoda Karoq.
2021
2021
Model
Pass rate (%)
Model
Pass rate (%)
Honda Jazz
95.5
Honda Jazz
95.4
Honda HR-V
94.8
Honda HR-V
94.6
Honda CR-V
94.5
Honda CR-V
94.4
Audi Q2
93.9
Mazda CX-3
93.8
Suzuki Celerio
93.6
Skoda Karoq
93.7
The bottom 5 makes are all European. Yet again.
Just as Japanese makes dominate the leader board, the wall of shame is very European – just as it was in 2021. Peugeot have escaped the bottom 5 at the expense of MG. However, the bottom 3 is still made up of less fortunate (and, it would seem, reliable) French makes.
2021
2022
Make
Pass rate (%)
Model
Pass rate (%)
Peugeot
88.2
MG
88
Vauxhall
87.5
Vauxhall
87.6
Renault
86.7
DS
87
DS
86
Renault
86.6
Citroen
86
Citroen
86.4
The worst models are getting worse.
The bottom five models list is almost identical to the last set of data – but overall their pass rates are going down. Apart from a slight uptick for the Vivaro, the bottom 5 are all did slightly worse than they managed a year before.
It comes as no surprise that the average annual mileage of UK drivers has reduced significantly during the unpredictable year that is 2020.
Inevitably, the nation’s newfound working-from-home arrangements have contributed to this reduction in mileage. As workers parked up their cars in favour of opening up the laptop in their makeshift home offices, their mileage has plummeted now that the daily commute is no longer an essential part of their day.
But just how significant is this reduction in mileage? And what does it mean for the future of our roads?
Annual mileage was already decreasing before the pandemic hit.
Year by year, cars in the UK are continuing to drive less. We’ve seen by just how much Britain’s mileage has been steadily decreasing thanks to our analysis of official MOT data from the Department for Transport earlier this year.
Before Covid-19 hit, it was expected that the average annual mileage of a car in the UK would reduce to around 6,970 miles in 2020. But now that we find ourselves in the midst of an unprecedented global pandemic and a second lockdown, and we’ve seen the daily miles driven by our members reduce by a quarter since the first lockdown began, we project that the annual mileage will actually go as low as 5,960 miles per car in the UK. Clearly, the downward trend continues, albeit much steeper than expected.
We’ve surveyed UK drivers and learned that the number of people traveling to work by car has fallen by 3.5 million to 11.4 million, decreasing from a total of 14.8 million before Covid-19 happened. On average, commuters have been driving around 30 miles less each week, compared to their pre-lockdown mileage in March. Simply put, that’s a lot.
The Government’s advice to avoid unnecessary journeys has played a major role in this reduction in mileage, as drivers obeyed guidelines to only make essential car trips. Up to 26 million UK drivers are now driving less since the pandemic started.
48% of UK drivers have cut their mileage compared to the start of the pandemic, while just 7% feel that they are actually driving more since Covid-19 struck. The most popular reason for driving among those people was a reluctance to return to public transport over health concerns.
Adding to reduced mileage is the public’s desire to find new ways to get around, with 34% saying that they’ve been walking more, and 28% now skipping the weekly supermarket trip in favour of convenient online shopping and delivery instead. While these small changes to everyday life may be temporary, it’s possible that drivers’ relationships with their cars will continue beyond the pandemic, as old habits morph into newer, more environmentally-friendly ones.
The daily commute has changed.
Working from home has transformed the driving habits of many, as they’ve seen their daily commute become temporarily obsolete. Before the pandemic, one of the most common car journeys for drivers was the everyday commute to work. Now that flexible and remote working arrangements have become a staple for many employees, these sorts of trips have drastically reduced.
On average, commuters are now doing 30 miles fewer each week compared to their usual mileage before the first lockdown came into effect in March of this year. It may not seem like much in these terms, but that adds up to a reduction of just over 1,500 miles a year for the average commuter.
With the shift to working from home proving to be a moderate success, it’s likely that employers will explore this arrangement beyond the pandemic, as we’ve all learned that it’s possible to work remotely and still get the job done (ideally to as high a standard as before – but perhaps with some more coffee breaks added).
How does this affect car insurance policies?
Taking into consideration the fact that we are now in the middle of a second UK lockdown, the downward trend in driving levels will likely continue well into 2021, as drivers reevaluate their driving habits and explore new ways of getting around prompted by lockdowns.
While the Financial Conduct Authority has called on insurers to review the value of their services during the pandemic, we urge drivers to get in touch with their car insurance provider to adjust their estimated mileage for the year and enquire about refunds from their premium. As the old saying goes, if you don’t ask, you don’t get.
If you’re driving less than you estimated for the year, it’s worth getting in touch with your insurer to talk about your premium. While it may seem like a daunting task, you’re perfectly entitled to ask questions, especially during times like these. Everyone is adapting to the new normal, so use that to your advantage and be curious.
Of course, if you’re on a pay-by-mile policy with By Miles, you’ll only ever pay for the miles you actually drive, so if you find that you’re driving less at the moment (and intend on keeping things that way), you’ll pay less as a result. It’s better for your wallet and the planet, so it’s win-win.
UK drivers plan to cut their mileage long-term.
In July, we carried out a survey which showed that UK drivers want to reduce their mileage long-term, beyond the pandemic restrictions.
30 million drivers said they planned to cut down on their annual mileage in the next year, but 93% admitted that that would be a difficult task without some incentives to do so. Cheaper monthly car insurance premiums, improved public transport conditions and pay-per-mile road tax are ways to encourage drivers to clock up less mileage, but there’s a lack of information being made available to the public about how to do so.
If drivers want to continue reducing their mileage, the responsibility is on them to research and implement everyday changes. With some official guidance, life could be a lot easier for everyone involved. We’ve seen the environmental benefits of reduced emissions during lockdown. It’s only right that drivers are encouraged to continue reducing their mileage with financial incentives, and that falls on the shoulders of their insurers, our Government and the Department for Transport.
While we all hope for a return to a reasonable sense of normality in the coming months, the car insurance industry has an exciting opportunity right now to shape and inspire what this ‘new normal’ we keep hearing about actually looks like. We hope to see everyone playing their part in helping to shape a fairer and greener future for all.
Driving less during lockdown? See if you could save money with a pay-by-mile car insurance policy. Get a quick quote in under a minute here.
The last ten years of MOT data from the Department for Transport have shown that mileage is steadily decreasing each year, and the Government’s latest stats show this reduction continuing.
Based on 2015-2019 data we project the average annual mileage for UK drivers in 2020 would be 6,970 miles, but due to the nationwide lockdown during coronavirus, that annual mileage will likely end up much lower.
Looking at the mileage driven on our real-time policies, our Miles Index shows a decline in mileage of 58% since the UK locked down on 23rd March 2020, so with 3 months of reduced mileage due to Covid-19, we estimate that this annual average will drop to just 5,960 miles.
Following the release of this latest data, our team has crunched the numbers, looking at the average mileage driven across the country, pass rates for different makes and models of car, and even which day you should get your MOT done to increase the chances of passing. You can read the full analysis below.
The 2020 UK mileage forecast from By Miles:
Forecast
Average Annual Mileage
per Car
2020 (with lockdown)
5,960
2020 (without lockdown)
6,970
Average UK mileage according to latest MOT data:
Year
Average Annual Mileage
per Car
2019
7,090
2018
7,059
2017
7,134
2016
7,250
2015
7,334
2014
7,421
2013
7,409
2012
7,467
2011
7,473
2010
7,559
2009
7,524
2008
7,637
2007
7,712
Average 2019 UK MOT pass rate
Average 2019 UK MOT pass rate (for all cars): 74.9%
Average 2019 UK MOT pass rate (cars between the ages of 3 and 5): 87.4%
Which car makes and models have the best MOT pass rates?
MOT League Table – Top 5 Brands
Japanese and German car manufacturers still dominate the top spots when it comes to pass rates, with Lexus boasting the highest percentage of MOT passes, followed very closely by Honda and Porsche.
Compared with 2017 MOT data, Lexus has overtaken Honda’s previous lead, jumping from a previous fourth place to take the top spot.
Toyota has fallen out of the top five this year, being overtaken by Mini and Suzuki. Subaru has also fallen out of the top 5 but only due to dropping below 10,000 MOTs – if included they would be fourth with a 91.9% pass rate.
Make
Number of
Passes
Number of
Fails
Pass Rate
LEXUS
19,692
1,300
93.8%
HONDA
91,516
6,201
93.7%
PORSCHE
17,464
1,201
93.6%
MINI
98,915
9,033
91.6%
SUZUKI
58,105
5,469
91.4%
MOT League Table – Bottom 5 Brands
French-made motors showed some of the worst MOT pass rates for 2019. Renault is bottom of the list, falling two spots lower than in 2017 data, despite now having a slightly higher pass rate than its previous 82.5%. Citroen has also had a 0.2% pass rate increase, but has overall dropped down one spot since 2017, to second worst pass rate for 2019.
Make
Number of
Passes
Number of
Fails
Pass Rate
VOLVO
63,473
10,138
86.2%
VAUXHALL
451,199
74,234
85.9%
DACIA
37,370
6,208
85.8%
CITROEN
148,888
27,153
84.6%
RENAULT
129,458
27,081
82.7%
MOT League Table – Top 5 Models
Despite not making it into the top five brands list, Toyota has come away with a third place spot on the top five models ranking, with its hybrid car, the Prius. The Honda Jazz and CR-V, both with a maximum 5-star safety rating from Euro NCAP, take the top two places for having the highest pass rates.
HONDA JAZZ
95.4%
HONDA CR-V
93.4%
TOYOTA PRIUS
93.1%
MERCEDES GLA
92.8%
TOYOTA RAV4
92.7%
MOT League Table – Bottom 5 Models
The Renault Megane was the car most likely to fail its MOT in 2019, with Renault’s Clio just two spaces above it.
VAUXHALL INSIGNIA
84.4%
VOLVO V40
83.9%
RENAULT CLIO
81.4%
CITROEN DS3
81.0%
RENAULT MEGANE
78.1%
Not enough analysis for you? Here are some quick links to even more data.
Data published: 20 May 2020 Data: The “Anonymised MOT tests and results” published by: Department for Transport (DfT) Data source:https://data.gov.uk/dataset/e3939ef8-30c7-4ca8-9c7c-ad9475cc9b2f/anonymised-mot-tests-and-results Data size: 28,751,424 tests MOTs Period: Data covers MOTs carried out in 2019 Analysis: Data crunching by ByMiles.co.uk 2020 projection calculations: Using linear regression on the 2015-2019 data the projected average mileage per car for 2020 would be 6,970 miles.
However the By Miles’ Miles Index shows motorists driving 58% less than normal since lockdown began on 23rd March 2020.
With 3 months of reduced mileage due to the Covid-19 lockdown in the UK, we estimate the average mileage per car for 2020 will drop to 5,960 miles.
MOT pass rate by day of the week.
Sunday is the best day to get your MOT done with a 2% increase on its pass rate from 2017 figures, followed closely by Saturday.
Trends seem to suggest that the earlier in the week you do your MOT, the worse the result will be. Monday remains the day with the lowest pass rate, with the percentages becoming consistently higher as you move further through the week.
Day of Test
Number of
Passes
Number of
Fails
Pass Rate
Monday
3,868,089
1,385,946
73.6%
Tuesday
4,037,134
1,429,590
73.9%
Wednesday
3,921,991
1,369,603
74.1%
Thursday
3,836,518
1,312,605
74.5%
Friday
3,833,427
1,233,581
75.7%
Saturday
1,967,701
487,351
80.2%
Sunday
55,508
12,380
81.8%
Average annual mileage by fuel type.
Diesel cars have the highest average mileage according to the data, followed closely behind by Hybrid cars. Petrol car drivers are now driving the lowest annual mileage on average, despite making up the majority of MOT tests overall.
Fuel Type
Average Mileage
Number of MOTS
Diesel
10,239
774,128
Electric (100%)
8,425
5,620
Hybrid
9,700
25,110
Petrol
6,483
777,857
MOT pass rate by fuel type.
Hybrid cars have the highest pass rate, despite petrol and diesel cars having a much higher volume of passes. Diesel cars statistically have the lowest pass rate out of all fuel types, which will most likely be affected by the fact that they tend to be driven the highest mileage.
Fuel Type
Number of
Passes
Number of
Fails
Pass Rate
Hybrid
89,305
8,038
91.7%
Petrol
2,018,123
231,819
89.7%
Electric (100%)
16,316
2,410
87.1%
Diesel
2,216,514
339,531
86.7%
Note: The above only includes cars that were 3 to 5 years old.
MOT pass rate by colour of car.
Turquoise, maroon and brown cars continue to have the highest pass rates based on the 2019 data, staying consistent with the previous MOT data from 2017.
Orange cars are experiencing a revival as they’ve jumped from the 14th spot to fourth place, while cream and multi-coloured cars remain at the bottom of the list. Black and white cars continue to be the most popular colour choices for drivers, but are placed third and fourth last in terms of their MOT pass rates.
Car Colour
Number of Passes
Number of Fails
Pass Rate
Turquoise
2,907
242
92.3%
Maroon
2,271
217
91.3%
Brown
44,796
4,823
90.3%
Orange
32,227
3,603
89.9%
Gold
7,007
798
89.8%
Bronze
11,492
1,327
89.6%
Pink
3,983
476
89.3%
Beige
19,106
2,310
89.2%
Red
517,887
63,344
89.1%
Blue
613,892
75,352
89.1%
Grey
654,588
82,715
88.8%
Silver
510,579
65,834
88.6%
Green
47,408
6,435
88.0%
Purple
19,766
2,698
88.0%
Yellow
21,421
2,951
87.9%
Black
803,973
115,871
87.4%
White
1,021,987
151,859
87.1%
Cream
7,758
1,164
87.0%
Multi-colour
1,406
496
73.9%
Note: The above only includes cars that were 3 to 5 years old.
MOT pass rate by make.
It’s tight at the top, with Lexus, Honda and Porsche leading the way, while Renault, Citroen and Dacia trail at the bottom. Lexus has jumped from fourth to first place compared with the 2017 data, while Smart has had a huge drop from fifth in 2017, to 16th place in 2019’s list.
Make
Number of Passes
Number of Fails
Pass Rate
LEXUS
19,692
1,300
93.8%
HONDA
91,516
6,201
93.7%
PORSCHE
17,464
1,201
93.6%
MINI
98,915
9,033
91.6%
SUZUKI
58,105
5,469
91.4%
TOYOTA
169,390
16,331
91.2%
SKODA
119,379
12,115
90.8%
AUDI
248,830
26,845
90.3%
TESLA
2,272
252
90.0%
MAZDA
67,900
7,926
89.5%
NISSAN
248,819
29,368
89.4%
BMW
241,526
29,147
89.2%
VOLKSWAGEN
382,045
47,877
88.9%
HYUNDAI
127,435
16,037
88.8%
MITSUBISHI
42,090
5,404
88.6%
SMART
11,493
1,485
88.6%
LAND ROVER
111,372
14,820
88.3%
MERCEDES
214,443
28,544
88.3%
KIA
124,464
17,127
87.9%
PEUGEOT
195,328
27,254
87.8%
FORD
610,711
86,855
87.5%
JAGUAR
35,798
5,163
87.4%
SEAT
73,723
10,666
87.4%
JEEP
13,754
2,080
86.9%
FIAT
117,218
18,285
86.5%
ALFA ROMEO
7,816
1,225
86.5%
VOLVO
63,473
10,138
86.2%
VAUXHALL
451,199
74,234
85.9%
DACIA
37,370
6,208
85.8%
CITROEN
148,888
27,153
84.6%
RENAULT
129,458
27,081
82.7%
Note: The above only includes manufacturers with more than 10,000 cars tested for the year, with the addition of Alfa Romeo (9,041), Subaru (5,846) and Tesla (2,524). Data only includes cars that were 3 to 5 years old.
MOT pass rate by model.
The Honda Jazz reigns supreme with a 95.4% MOT test pass rate, clinching the top spot in 2019 (having been second highest pass rate at 95.3% when we last did this analysis for the 2017 MOT data). Honda and Toyota both have two entries in the top five, with Toyota adding a third to complete the top ten. French cars from Renault and Citroen continue to dominate the bottom of the list.
Make
Model
Pass
Fail
Pass Rate
HONDA
JAZZ
34,039
1,656
95.4%
HONDA
CR-V
26,347
1,872
93.4%
TOYOTA
PRIUS
11,559
853
93.1%
MERCEDES
GLA
13,073
1,018
92.8%
TOYOTA
RAV4
10,043
787
92.7%
SKODA
YETI
22,178
1,782
92.6%
VAUXHALL
MERIVA
13,853
1,116
92.5%
MINI
COUNTRYMAN
17,853
1,485
92.3%
TOYOTA
AYGO
38,608
3,298
92.1%
SUZUKI
SWIFT
20,389
1,760
92.1%
AUDI
Q5
17,796
1,542
92.0%
HYUNDAI
I20
23,186
2,044
91.9%
MINI
ONE
15,320
1,351
91.9%
AUDI
TT
12,039
1,064
91.9%
HONDA
CIVIC
26,583
2,355
91.9%
VOLKSWAGEN
UP
30,219
2,686
91.8%
TOYOTA
YARIS
52,434
4,668
91.8%
AUDI
Q3
24,481
2,190
91.8%
MINI
COOPER
41,401
3,717
91.8%
SKODA
CITIGO
14,555
1,327
91.6%
NISSAN
NOTE
29,324
2,805
91.3%
PEUGEOT
108
25,993
2,534
91.1%
TOYOTA
AURIS
29,042
2,833
91.1%
FORD
KUGA
48,952
4,780
91.1%
SKODA
FABIA
30,104
2,967
91.0%
BMW
218
11,958
1,180
91.0%
AUDI
A1
40,619
4,036
91.0%
VAUXHALL
MOKKA
68,127
6,840
90.9%
BMW
X1
10,608
1,112
90.5%
MINI
COOPER S
11,942
1,257
90.5%
VOLKSWAGEN
GOLF
116,938
12,309
90.5%
VOLKSWAGEN
TIGUAN
31,593
3,330
90.5%
FORD
B-MAX
18,455
1,961
90.4%
NISSAN
MICRA
22,463
2,401
90.3%
CITROEN
C1
28,834
3,086
90.3%
SKODA
OCTAVIA
32,949
3,559
90.3%
AUDI
A3
71,105
7,682
90.2%
AUDI
A6
21,195
2,308
90.2%
NISSAN
JUKE
63,873
7,017
90.1%
KIA
PICANTO
23,905
2,643
90.0%
HYUNDAI
I10
38,693
4,318
90.0%
MAZDA
6
12,079
1,362
89.9%
MAZDA
CX-5
12,052
1,363
89.8%
BMW
3 SERIES
52,112
5,899
89.8%
BMW
118
15,204
1,759
89.6%
NISSAN
QASHQAI
90,289
10,465
89.6%
SEAT
LEON
31,360
3,642
89.6%
FORD
FOCUS
128,959
15,055
89.5%
BMW
520
21,017
2,517
89.3%
FORD
C-MAX
20,057
2,418
89.2%
PEUGEOT
208
47,914
5,809
89.2%
BMW
X3
11,346
1,413
88.9%
FIAT
PANDA
12,881
1,610
88.9%
MAZDA
2
16,197
2,051
88.8%
LAND ROVER
DISCOVERY SPORT
18,296
2,318
88.8%
VOLKSWAGEN
POLO
81,759
10,398
88.7%
PEUGEOT
2008
28,306
3,602
88.7%
BMW
420
16,443
2,100
88.7%
MITSUBISHI
OUTLANDER
18,409
2,352
88.7%
DACIA
DUSTER
10,145
1,303
88.6%
LAND ROVER
RANGE ROVER EVOQUE
32,107
4,175
88.5%
MERCEDES
A
43,547
5,671
88.5%
MERCEDES
C
52,689
6,888
88.4%
FORD
KA
24,498
3,210
88.4%
VOLVO
XC60
19,121
2,521
88.4%
BMW
X5
10,724
1,423
88.3%
AUDI
A4
30,554
4,071
88.2%
KIA
RIO
18,658
2,491
88.2%
MAZDA
3
17,860
2,392
88.2%
FORD
ECOSPORT
14,153
1,912
88.1%
AUDI
A5
17,767
2,428
88.0%
LAND ROVER
DISCOVERY
15,357
2,108
87.9%
NISSAN
X-TRAIL
13,080
1,809
87.9%
PEUGEOT
3008
13,190
1,835
87.8%
BMW
116
26,172
3,665
87.7%
LAND ROVER
RANGE ROVER SPORT
18,048
2,556
87.6%
MERCEDES
CLA
10,571
1,511
87.5%
LAND ROVER
RANGE ROVER
10,492
1,502
87.5%
MERCEDES
E
34,325
4,954
87.4%
HYUNDAI
I30
20,494
2,975
87.3%
VAUXHALL
ADAM
19,071
2,796
87.2%
KIA
SPORTAGE
38,007
5,584
87.2%
FORD
MONDEO
25,762
3,793
87.2%
CITROEN
C3
21,416
3,156
87.2%
VOLKSWAGEN
TRANSPORTER
27,376
4,054
87.1%
MITSUBISHI
L200
10,718
1,590
87.1%
FORD
FIESTA
210,095
31,396
87.0%
RENAULT
CAPTUR
35,518
5,343
86.9%
HYUNDAI
IX35
18,749
2,858
86.8%
PEUGEOT
308
23,265
3,565
86.7%
KIA
CEED
18,722
2,901
86.6%
PEUGEOT
PARTNER
23,679
3,673
86.6%
VAUXHALL
ASTRA
77,982
12,132
86.5%
JAGUAR
XF
17,602
2,743
86.5%
FIAT
500
59,430
9,354
86.4%
JAGUAR
XE
10,499
1,670
86.3%
VOLKSWAGEN
PASSAT
27,177
4,420
86.0%
VAUXHALL
ZAFIRA
32,166
5,392
85.6%
SEAT
IBIZA
31,057
5,335
85.3%
DACIA
SANDERO
22,724
4,053
84.9%
VAUXHALL
CORSA
135,517
24,261
84.8%
FORD
RANGER
10,360
1,866
84.7%
CITROEN
C4
40,761
7,545
84.4%
VAUXHALL
INSIGNIA
45,142
8,367
84.4%
VOLVO
V40
24,911
4,786
83.9%
RENAULT
CLIO
39,044
8,926
81.4%
CITROEN
DS3
16,307
3,823
81.0%
RENAULT
MEGANE
10,125
2,842
78.1%
Notes: The above only includes models with more than 10,000 cars tested for the year, and cars that were 3 to 5 years old.
Average mileage by make.
Tesla drivers are clearly making the most of their new wheels, driving the most miles on average, though this is based on a low number of MOTs due to their newness on the scene. Dacia has gone from first to fourth place in 2019 compared with the 2017 MOT data, while Skoda and Mercedes retain second and third place.
Make
Average Mileage
Number of MOTs
TESLA
12,732
994
SKODA
8,660
382,641
MERCEDES
8,601
498,470
DACIA
8,442
47,157
AUDI
8,147
777,631
SEAT
8,128
257,741
VOLVO
8,109
300,346
BMW
7,826
841,682
VOLKSWAGEN
7,609
1,756,321
CITROEN
7,245
728,476
VAUXHALL
7,204
2,186,022
FORD
7,187
2,873,555
LAND ROVER
7,113
453,606
TOYOTA
7,087
992,491
MITSUBISHI
7,070
187,121
JEEP
7,070
28,988
LEXUS
7,053
81,767
KIA
6,956
398,876
PEUGEOT
6,867
1,007,101
RENAULT
6,803
715,561
NISSAN
6,776
895,123
ALFA ROMEO
6,632
47,603
HONDA
6,521
686,393
HYUNDAI
6,452
437,980
SAAB
6,436
72,287
MAZDA
6,280
332,417
MERCEDES
6,258
245,798
SUBARU
6,188
43,726
MINI
5,932
370,531
JAGUAR
5,925
167,951
FIAT
5,755
495,027
CHEVROLET
5,706
72,694
SUZUKI
5,611
256,848
SMART
4,285
34,590
PORSCHE
3,639
72,316
ROVER
3,432
54,892
MG
2,822
40,558
Notes: The above only includes makes with more than 25,000 cars tested for the year. And Tesla!
MOT pass rate by postcode.
Drivers in the Enfield postcode area have a confident lead with the highest pass rate in the UK, followed by Slough. Eastern Scotland has the lowest pass rate, followed by the South West of England. The people of Dorchester boast the oldest cars being taken for MOT, while the Motherwell in Scotland tend to have some of the newest cars.
Postcode
Area
Number of
Passes
Number of
Fails
Pass Rate
Average Age
of Car (Years)
EN
147,262
26,095
84.9%
9.9
SL
173,036
35,079
83.1%
10.0
E
198,033
40,311
83.1%
10.2
IG
104,269
21,486
82.9%
9.5
SE
212,137
44,299
82.7%
10.6
RM
193,213
41,035
82.5%
9.5
UB
138,616
29,844
82.3%
10.2
CR
164,479
36,677
81.8%
10.0
BR
96,241
21,532
81.7%
9.1
N
171,575
38,875
81.5%
10.7
TW
178,860
41,019
81.3%
10.0
DA
174,202
39,966
81.3%
9.5
SS
216,033
49,902
81.2%
10.1
CM
285,923
67,875
80.8%
9.4
XX
1,526
367
80.6%
11.3
HA
138,502
34806
79.9%
10.1
NW
165,002
41,469
79.9%
9.4
KT
210,406
53,126
79.8%
9.8
W
73,070
19,230
79.2%
9.9
SG
170,828
45,020
79.1%
9.6
HP
222,666
58,800
79.1%
9.6
B
677,578
178,973
79.1%
9.6
AL
105,374
28,067
79.0%
9.2
LU
140,646
37,595
78.9%
9.7
SM
57,690
15,791
78.5%
10.7
ME
248,127
70,124
78.0%
9.6
LE
400,024
114,000
77.8%
9.6
RG
346,911
99,489
77.7%
9.5
SW
122,233
35,059
77.7%
10.0
CV
319,894
93,287
77.4%
9.5
L
231,581
67,704
77.4%
9.0
BB
176,364
51,739
77.3%
9.3
S
487,068
143,904
77.2%
9.3
CO
171,739
51,345
77.0%
10.2
BL
157,532
47,353
76.9%
8.8
WA
233,428
70,283
76.9%
8.6
WF
194,123
58,677
76.8%
9.0
HX
56,756
17,188
76.8%
9.4
RH
231,441
71,142
76.5%
10.0
MK
223,547
69,359
76.3%
9.3
DE
291,487
90,895
76.2%
9.3
M
313,047
97,918
76.2%
9.6
WV
145,905
45,904
76.1%
9.4
DY
152,202
48,425
75.9%
9.7
TN
294,228
94,581
75.7%
10.2
GU
299,911
96,469
75.7%
9.8
CB
156,428
50,436
75.6%
9.8
WD
95,260
30,754
75.6%
9.1
DH
100,645
32,682
75.5%
8.6
SO
276,175
89,943
75.4%
9.8
DG
52,148
17,027
75.4%
9.0
CW
129,361
42,519
75.3%
8.9
IP
257,052
84,525
75.3%
10.1
PE
383,092
127,072
75.1%
9.8
DN
276,797
91,828
75.1%
9.2
SK
219,772
73,131
75.0%
8.9
WN
96,504
32,165
75.0%
8.9
PR
195,280
65,152
75.0%
9.2
OX
236,507
79,373
74.9%
9.9
NE
348,351
117,528
74.8%
8.6
WR
124,903
42,337
74.7%
9.9
CA
124,158
42,245
74.6%
8.7
BD
183,099
62,677
74.5%
9.4
SY
145,305
49,925
74.4%
9.9
WS
157,133
54,368
74.3%
9.3
OL
139,551
48,409
74.2%
9.0
TD
40,771
14,175
74.2%
8.7
HG
57,889
20,554
73.8%
8.4
KW
18,362
6,555
73.7%
9.4
CT
164,998
58,972
73.7%
10.2
LA
116,243
41,578
73.7%
9.4
LL
207,087
75,156
73.4%
10.1
ZE
8,051
2,923
73.4%
7.9
NR
292,322
106,316
73.3%
10.2
TS
191,798
69,819
73.3%
8.8
HR
79,387
29,196
73.1%
10.4
HS
9,506
3,507
73.1%
9.3
CH
232,942
86,241
73.0%
9.1
DL
117,784
43,615
73.0%
8.9
SN
185,461
68,749
73.0%
9.8
NN
263,304
98,110
72.9%
9.5
ML
103,763
38,837
72.8%
7.5
KA
113,440
42,462
72.8%
8.0
SA
268,372
100,645
72.7%
9.4
NP
176,271
66,986
72.5%
9.4
G
331,325
126,017
72.4%
7.7
FY
88,681
34,429
72.0%
9.6
GL
260,638
101,446
72.0%
10.2
CF
332,933
130,534
71.8%
8.9
HD
80,547
31,782
71.7%
8.6
SR
70,698
28,080
71.6%
8.5
BH
221,055
89,296
71.2%
10.4
NG
378,961
153,284
71.2%
9.4
LS
218,425
89,100
71.0%
8.8
BN
253,998
103,786
71.0%
10.3
IV
87,001
35,837
70.8%
8.3
LN
116,208
48,116
70.7%
9.4
FK
88,462
37,023
70.5%
7.8
SP
98,536
41,387
70.4%
10.3
PO
296,996
124,900
70.4%
10.3
DT
79,123
33,334
70.4%
11.2
TF
73,818
31,143
70.3%
9.7
PA
92,256
38,991
70.3%
7.9
TA
132,789
56,137
70.3%
10.8
ST
218,461
92,539
70.2%
9.0
EH
251,846
107,885
70.0%
8.3
YO
192,393
82,543
70.0%
9.1
BS
353,936
153,760
69.7%
10.0
BA
176,235
77,990
69.3%
10.2
PH
57,740
26,427
68.6%
8.3
HU
133,647
61,801
68.4%
8.8
LD
17,757
8,296
68.2%
10.2
TQ
102,807
48,651
67.9%
11.0
EX
219,007
105,331
67.5%
10.5
AB
152,308
73,657
67.4%
8.0
PL
193,869
101,020
65.7%
10.5
TR
113,074
60,407
65.2%
10.7
DD
74,056
43,674
62.9%
8.2
KY
100,795
61,877
62.0%
8.6
MOT pass rate by age of car.
Unsurprisingly, the newer the car, the higher the MOT pass rate. However, when you get to cars that are over 50 years old, the pass rate starts to increase to over 80%, with cars that are 71 years old having a better pass rate as cars that are 3 years old (we are in awe of all of you classic car owners, you sure know how to look after a motor).
Age of Car (Years)
Number of
Passes
Number of
Fails
MOT
Pass Rate
0
2,991
44
98.6%
1
20,502
931
95.7%
2
61,193
3,863
94.1%
3
2,554,656
261,445
90.7%
4
2,336,362
302,961
88.5%
5
2,082,208
345,394
85.8%
6
1,805,731
380,961
82.6%
7
1,528,809
402,185
79.2%
8
1,389,758
435,705
76.1%
9
1,349,433
501,148
72.9%
10
1,237,166
516,108
70.6%
11
1,209,866
579,261
67.6%
12
1,250,765
647,925
65.9%
13
1,051,932
596,442
63.8%
14
878,446
542,965
61.8%
15
716,376
469,629
60.4%
16
573,614
380,075
60.1%
17
409,586
271,912
60.1%
18
273,767
180,588
60.3%
19
174,612
111,163
61.1%
20
121,071
74,175
62.0%
21
82,919
47,987
63.3%
22
63,610
35,576
64.1%
23
44,551
24,481
64.5%
24
35,902
18,725
65.7%
25
26,795
13,041
67.3%
26
22,339
10,811
67.4%
27
19,596
9,135
68.2%
28
21,539
9,435
69.5%
29
20,363
8,374
70.9%
30
18,387
7,429
71.2%
31
12,761
5,168
71.2%
32
10,869
4,216
72.1%
33
8,840
3,522
71.5%
34
7,796
3,110
71.5%
35
6,312
2,290
73.4%
36
6,268
2,278
73.3%
37
4,672
1,741
72.9%
38
4,877
1,733
73.8%
39
5,313
1,751
75.2%
40
5,356
1,632
76.6%
41
2,991
892
77.0%
42
2,324
646
78.2%
43
1,943
503
79.4%
44
2,218
588
79.0%
45
1,862
442
80.8%
46
2,743
679
80.2%
47
2,679
622
81.2%
48
12,096
3,132
79.4%
49
5,220
1,157
81.9%
50
3,483
703
83.2%
51
3,157
695
82.0%
52
3,193
646
83.2%
53
2,542
508
83.3%
54
2,461
469
84.0%
55
1,941
368
84.1%
56
1,649
299
84.7%
57
1,328
209
86.4%
58
1,381
231
85.7%
59
1,251
211
85.6%
60
828
131
86.3%
61
529
96
84.6%
62
480
71
87.1%
63
393
62
86.4%
64
477
78
85.9%
65
344
53
86.6%
66
316
50
86.3%
67
206
25
89.2%
68
209
29
87.8%
69
151
16
90.4%
70
139
16
89.7%
71
119
9
93.0%
72
94
5
94.9%
73
46
2
95.8%
74
22
2
91.7%
75
21
1
95.5%
76
26
1
96.3%
77
26
2
92.9%
78
13
26
33.3%
79
30
4
88.2%
80
95
6
94.1%
81
133
11
92.4%
82
148
10
93.7%
83
140
7
95.2%
84
135
10
93.1%
85
138
5
96.5%
86
119
3
97.5%
87
84
4
95.5%
88
83
4
95.4%
89
69
1
98.6%
90
73
69
51.4%
91
54
3
94.7%
92
41
54
43.2%
93
30
2
93.8%
94
25
30
45.5%
95
17
25
40.5%
96
10
17
37.0%
97
8
10
44.4%
98
4
8
33.3%
99
1
4
20.0%
102
1
1
50.0%
103
5
1
83.3%
104
2
1
66.7%
105
2
1
66.7%
106
4
2
66.7%
107
1
4
20.0%
108
1
1
50.0%
110
2
1
66.7%
113
1
1
50.0%
115
1
1
50.0%
118
49
4
92.5%
119
44
7
86.3%
120
1
44
2.2%
130
1
1
50.0%
132
2
1
66.7%
133
1
1
50.0%
134
1
1
50.0%
150
1
1
50.0%
152
1
1
50.0%
MOT bookings by month.
Unsurprisingly, the months when the new registration plates are released tend to be the busiest at MOT centres. March is the most popular month for MOTs, followed by September. December is the quietest as people wind down for the festive season, with November not far behind.
MOT Test Month
Number of MOTs
January
1,752,895
February
1,725,107
March
2,345,106
April
1,904,231
May
1,983,567
June
1,837,283
July
1,797,146
August
1,722,408
September
2,062,040
October
1,825,453
November
1,528,819
December
1,036,313
MOT bookings by day of the year.
The highest day’s MOT pass rate of 2019 goes to Christmas Day (25th December), at a massive 100%. So if you can find a garage that will test your car on that day (it was the quietest day of the year with only 52 tests carried out in total in 2019, so it may just be one or two open), then it’s well advised.
The lowest pass rate day of the year was January 3rd (71.5%) as the excitement of New Year’s Eve begins to fade, and the testers start to wonder why they were giving December’s cars such an easy ride.
The busiest testing day of 2019 was the 25th March.
MOT Date
Number of MOTs
MOT Pass Rate
01-Jan-19
288
87.5%
02-Jan-19
57,471
71.7%
03-Jan-19
70,747
71.5%
04-Jan-19
73,047
73.5%
05-Jan-19
35,774
77.9%
06-Jan-19
1,036
79.6%
07-Jan-19
79,415
72.5%
08-Jan-19
77,348
72.8%
09-Jan-19
74,022
73.6%
10-Jan-19
72,374
73.7%
11-Jan-19
74,374
74.9%
12-Jan-19
39,951
79.7%
13-Jan-19
1,144
83.4%
14-Jan-19
79,946
72.4%
15-Jan-19
76,562
72.9%
16-Jan-19
73,835
74.1%
17-Jan-19
70,330
74.1%
18-Jan-19
72,689
74.5%
19-Jan-19
39,956
79.4%
20-Jan-19
1,153
81.8%
21-Jan-19
78,644
72.6%
22-Jan-19
75,079
73.6%
23-Jan-19
70,805
73.9%
24-Jan-19
69,251
73.8%
25-Jan-19
74,294
74.2%
26-Jan-19
40,708
79.1%
27-Jan-19
1,110
78.8%
28-Jan-19
76,443
71.8%
29-Jan-19
70,705
72.3%
30-Jan-19
63,553
72.9%
31-Jan-19
60,841
72.5%
01-Feb-19
59,063
74.2%
02-Feb-19
35,517
78.7%
03-Feb-19
1,072
78.9%
04-Feb-19
71,447
72.7%
05-Feb-19
67,710
72.7%
06-Feb-19
65,711
73.3%
07-Feb-19
65,204
73.4%
08-Feb-19
69,295
75.2%
09-Feb-19
37,975
79.1%
10-Feb-19
1,131
81.0%
11-Feb-19
79,264
73.0%
12-Feb-19
77,082
73.4%
13-Feb-19
73,557
73.7%
14-Feb-19
71,637
74.4%
15-Feb-19
74,294
75.2%
16-Feb-19
38,953
79.1%
17-Feb-19
1,073
81.2%
18-Feb-19
86,878
73.6%
19-Feb-19
84,151
74.1%
20-Feb-19
82,466
74.6%
21-Feb-19
81,680
74.9%
22-Feb-19
84,345
75.7%
23-Feb-19
42,495
80.1%
24-Feb-19
1,296
79.7%
25-Feb-19
94,394
74.3%
26-Feb-19
93,252
74.4%
27-Feb-19
91,584
75.0%
28-Feb-19
92,581
75.5%
01-Mar-19
95,824
76.4%
02-Mar-19
48,368
80.7%
03-Mar-19
1,574
81.9%
04-Mar-19
100,354
74.8%
05-Mar-19
96,837
74.5%
06-Mar-19
95,945
75.7%
07-Mar-19
94,517
75.8%
08-Mar-19
96,456
76.8%
09-Mar-19
49,301
80.7%
10-Mar-19
1,565
81.3%
11-Mar-19
102,765
74.8%
12-Mar-19
102,604
76.2%
13-Mar-19
97,752
75.2%
14-Mar-19
97,692
76.2%
15-Mar-19
96,576
77.2%
16-Mar-19
50,754
81.2%
17-Mar-19
1,417
80.9%
18-Mar-19
103,948
74.9%
19-Mar-19
102,531
75.0%
20-Mar-19
100,680
75.5%
21-Mar-19
98,950
75.6%
22-Mar-19
100,234
76.5%
23-Mar-19
50,438
80.4%
24-Mar-19
1,450
78.9%
25-Mar-19
105,138
74.2%
26-Mar-19
103,510
74.2%
27-Mar-19
100,178
74.3%
28-Mar-19
98,281
74.6%
29-Mar-19
99,378
75.9%
30-Mar-19
48,710
80.1%
31-Mar-19
1,379
81.3%
01-Apr-19
88,320
72.0%
02-Apr-19
85,831
72.8%
03-Apr-19
79,973
72.9%
04-Apr-19
77,656
73.6%
05-Apr-19
77,350
74.3%
06-Apr-19
40,787
79.1%
07-Apr-19
1,258
81.3%
08-Apr-19
85,947
72.5%
09-Apr-19
84,817
73.1%
10-Apr-19
81,710
73.1%
11-Apr-19
79,640
73.3%
12-Apr-19
80,223
75.0%
13-Apr-19
40,619
79.6%
14-Apr-19
1,150
83.0%
15-Apr-19
89,465
73.1%
16-Apr-19
88,873
73.7%
17-Apr-19
87,870
74.1%
18-Apr-19
86,553
76.0%
19-Apr-19
21,383
75.5%
20-Apr-19
24,882
80.3%
21-Apr-19
490
88.4%
22-Apr-19
7,750
72.0%
23-Apr-19
89,719
72.7%
24-Apr-19
94,102
73.4%
25-Apr-19
92,127
73.7%
26-Apr-19
92,342
75.1%
27-Apr-19
45,402
80.3%
28-Apr-19
1,242
81.4%
29-Apr-19
90,563
72.8%
30-Apr-19
86,187
72.5%
01-May-19
82,868
72.8%
02-May-19
79,942
73.3%
03-May-19
80,366
75.3%
04-May-19
38,441
79.8%
05-May-19
1,071
80.6%
06-May-19
9,045
72.6%
07-May-19
88,383
72.8%
08-May-19
88,453
74.5%
09-May-19
85,346
74.5%
10-May-19
84,848
75.2%
11-May-19
43,902
80.1%
12-May-19
1,241
81.9%
13-May-19
89,217
73.4%
14-May-19
89,084
73.9%
15-May-19
86,176
74.0%
16-May-19
82,576
74.3%
17-May-19
82,999
75.3%
18-May-19
42,910
80.4%
19-May-19
1,229
81.1%
20-May-19
89,498
73.4%
21-May-19
88,598
73.7%
22-May-19
84,707
74.1%
23-May-19
82,623
74.7%
24-May-19
83,405
75.8%
25-May-19
37,893
80.5%
26-May-19
1,078
82.4%
27-May-19
10,386
73.0%
28-May-19
90,659
73.1%
29-May-19
88,329
73.3%
30-May-19
85,321
74.1%
31-May-19
82,973
75.1%
01-Jun-19
40,376
79.9%
02-Jun-19
1,167
80.8%
03-Jun-19
83,955
73.0%
04-Jun-19
79,929
73.3%
05-Jun-19
76,375
73.5%
06-Jun-19
76,469
74.1%
07-Jun-19
77,380
75.8%
08-Jun-19
40,305
80.9%
09-Jun-19
1,079
80.8%
10-Jun-19
85,709
74.3%
11-Jun-19
84,732
74.9%
12-Jun-19
81,093
74.9%
13-Jun-19
78,744
75.8%
14-Jun-19
79,566
76.5%
15-Jun-19
40,018
80.4%
16-Jun-19
1,081
82.8%
17-Jun-19
85,092
74.2%
18-Jun-19
83,544
74.3%
19-Jun-19
80,574
74.7%
20-Jun-19
79,387
74.9%
21-Jun-19
80,356
76.0%
22-Jun-19
40,933
80.7%
23-Jun-19
1,023
80.9%
24-Jun-19
86,988
73.8%
25-Jun-19
85,993
74.3%
26-Jun-19
82,451
74.0%
27-Jun-19
80,321
74.2%
28-Jun-19
81,709
75.3%
29-Jun-19
39,762
79.9%
30-Jun-19
1,172
83.1%
01-Jul-19
78,929
71.9%
02-Jul-19
75,369
71.9%
03-Jul-19
71,396
72.6%
04-Jul-19
68,793
72.9%
05-Jul-19
68,756
74.5%
06-Jul-19
36,501
79.8%
07-Jul-19
1,042
82.2%
08-Jul-19
76,569
72.4%
09-Jul-19
75,046
72.8%
10-Jul-19
72,712
73.3%
11-Jul-19
69,755
73.7%
12-Jul-19
69,324
75.2%
13-Jul-19
35,318
79.6%
14-Jul-19
995
79.3%
15-Jul-19
76,213
72.8%
16-Jul-19
75,105
73.3%
17-Jul-19
71,679
73.6%
18-Jul-19
68,885
73.9%
19-Jul-19
69,339
75.4%
20-Jul-19
35,566
80.1%
21-Jul-19
1,030
82.5%
22-Jul-19
78,002
73.2%
23-Jul-19
75,527
73.5%
24-Jul-19
70,906
73.2%
25-Jul-19
69,029
74.4%
26-Jul-19
68,046
74.7%
27-Jul-19
32,963
79.8%
28-Jul-19
868
81.2%
29-Jul-19
71,682
72.0%
30-Jul-19
68,260
72.3%
31-Jul-19
63,541
72.0%
01-Aug-19
61,516
72.2%
02-Aug-19
59,424
73.7%
03-Aug-19
29,993
78.8%
04-Aug-19
819
82.5%
05-Aug-19
68,774
72.2%
06-Aug-19
68,812
72.4%
07-Aug-19
66,806
73.4%
08-Aug-19
64,828
73.8%
09-Aug-19
64,139
75.5%
10-Aug-19
31,558
80.0%
11-Aug-19
799
82.2%
12-Aug-19
71,777
73.3%
13-Aug-19
72,803
73.9%
14-Aug-19
71,871
75.1%
15-Aug-19
68,658
74.8%
16-Aug-19
67,932
76.2%
17-Aug-19
32,533
80.1%
18-Aug-19
884
81.2%
19-Aug-19
78,851
74.4%
20-Aug-19
78,470
74.6%
21-Aug-19
75,458
74.9%
22-Aug-19
73,579
75.4%
23-Aug-19
73,827
76.9%
24-Aug-19
30,726
81.2%
25-Aug-19
837
81.5%
26-Aug-19
10,446
71.9%
27-Aug-19
87,031
75.1%
28-Aug-19
89,212
75.5%
29-Aug-19
88,199
76.0%
30-Aug-19
89,714
77.1%
31-Aug-19
42,132
81.5%
01-Sep-19
1,259
82.8%
02-Sep-19
93,273
75.1%
03-Sep-19
89,781
75.0%
04-Sep-19
86,333
75.5%
05-Sep-19
84,287
75.5%
06-Sep-19
85,260
76.7%
07-Sep-19
42,891
81.0%
08-Sep-19
1,197
83.1%
09-Sep-19
92,341
75.8%
10-Sep-19
91,651
75.7%
11-Sep-19
88,384
75.9%
12-Sep-19
86,735
76.3%
13-Sep-19
84,180
76.8%
14-Sep-19
43,355
81.5%
15-Sep-19
1,171
83.2%
16-Sep-19
91,966
75.4%
17-Sep-19
90,634
75.6%
18-Sep-19
88,389
75.8%
19-Sep-19
86,417
76.1%
20-Sep-19
88,896
77.4%
21-Sep-19
44,016
81.1%
22-Sep-19
1,252
84.5%
23-Sep-19
94,745
75.5%
24-Sep-19
94,359
76.7%
25-Sep-19
92,180
76.2%
26-Sep-19
91,132
76.3%
27-Sep-19
92,573
77.1%
28-Sep-19
45,296
81.0%
29-Sep-19
1,302
85.9%
30-Sep-19
86,785
73.9%
01-Oct-19
82,183
73.9%
02-Oct-19
74,766
73.1%
03-Oct-19
70,327
73.0%
04-Oct-19
72,226
74.9%
05-Oct-19
37,752
79.2%
06-Oct-19
1,064
81.2%
07-Oct-19
76,921
73.3%
08-Oct-19
75,215
73.3%
09-Oct-19
72,812
73.3%
10-Oct-19
70,477
73.7%
11-Oct-19
71,011
75.4%
12-Oct-19
37,673
80.3%
13-Oct-19
1,050
82.4%
14-Oct-19
77,319
73.9%
15-Oct-19
73,955
73.4%
16-Oct-19
72,126
74.2%
17-Oct-19
68,917
74.1%
18-Oct-19
70,572
75.5%
19-Oct-19
36,859
79.9%
20-Oct-19
1,044
82.5%
21-Oct-19
77,655
73.6%
22-Oct-19
74,322
72.9%
23-Oct-19
70,958
73.4%
24-Oct-19
70,303
74.4%
25-Oct-19
71,967
75.3%
26-Oct-19
36,117
80.8%
27-Oct-19
1,023
84.1%
28-Oct-19
75,457
72.6%
29-Oct-19
71,262
72.5%
30-Oct-19
67,428
72.8%
31-Oct-19
64,692
73.1%
01-Nov-19
65,218
74.8%
02-Nov-19
32,297
80.0%
03-Nov-19
1,023
82.0%
04-Nov-19
70,038
73.2%
05-Nov-19
66,022
72.9%
06-Nov-19
63,583
73.3%
07-Nov-19
62,650
74.2%
08-Nov-19
63,899
74.9%
09-Nov-19
35,488
80.2%
10-Nov-19
923
82.2%
11-Nov-19
70,387
73.6%
12-Nov-19
67,149
73.9%
13-Nov-19
63,038
73.9%
14-Nov-19
62,187
75.1%
15-Nov-19
63,890
75.7%
16-Nov-19
34,640
80.5%
17-Nov-19
876
83.3%
18-Nov-19
68,352
73.6%
19-Nov-19
64,620
73.9%
20-Nov-19
62,356
74.0%
21-Nov-19
60,590
74.1%
22-Nov-19
64,366
76.2%
23-Nov-19
34,752
80.8%
24-Nov-19
870
81.8%
25-Nov-19
69,847
74.3%
26-Nov-19
64,962
74.2%
27-Nov-19
61,723
74.4%
28-Nov-19
59,265
74.5%
29-Nov-19
61,149
75.0%
30-Nov-19
32,659
79.7%
01-Dec-19
891
82.4%
02-Dec-19
64,676
73.7%
03-Dec-19
60,622
73.3%
04-Dec-19
57,014
74.0%
05-Dec-19
54,897
74.4%
06-Dec-19
57,914
76.4%
07-Dec-19
31,762
80.4%
08-Dec-19
823
82.2%
09-Dec-19
65,086
74.3%
10-Dec-19
61,841
75.3%
11-Dec-19
57,289
75.6%
12-Dec-19
54,567
76.3%
13-Dec-19
51,514
76.3%
14-Dec-19
27,496
80.9%
15-Dec-19
747
82.3%
16-Dec-19
57,721
74.9%
17-Dec-19
52,339
75.3%
18-Dec-19
47,739
75.7%
19-Dec-19
44,706
76.8%
20-Dec-19
44,525
78.5%
21-Dec-19
21,129
81.4%
22-Dec-19
609
81.2%
23-Dec-19
37,088
77.4%
24-Dec-19
11,422
81.3%
25-Dec-19
52
100.0%
26-Dec-19
337
84.9%
27-Dec-19
18,997
77.2%
28-Dec-19
11,099
78.4%
29-Dec-19
429
78.7%
30-Dec-19
26,618
75.4%
31-Dec-19
14,364
77.5%
MOT pass rate by annual mileage.
The data continues to show that the safest cars are driven by low mileage drivers. Cars driven 7,000 miles per year or under have an average pass rate of 90%, compared with 83% for those that drive over 10,000 miles per year.
Drivers with an annual mileage of around 1,000 miles have the highest pass rate, and, as you’d expect, the pass rate decreases the further cars have traveled.
Annual Mileage
(rounded)
Number of
Passes
Number of
Fails
Pass Rate
0
12,920
832
93.9%
1,000
48,852
3,118
94.0%
2,000
83,762
6,201
93.1%
3,000
110,559
9,589
92.0%
4,000
126,089
12,762
90.8%
5,000
132,112
15,514
89.5%
6,000
129,062
17,004
88.4%
7,000
120,288
17,121
87.5%
8,000
107,943
16,929
86.4%
9,000
92,298
15,610
85.5%
10,000
78,275
14,055
84.8%
11,000
63,698
12,027
84.1%
12,000
51,957
10,438
83.3%
13,000
41,984
8,656
82.9%
14,000
33,399
7,196
82.3%
15,000
26,335
5,992
81.5%
16,000
20,872
4,992
80.7%
17,000
16,843
3,997
80.8%
18,000
13,522
3,363
80.1%
19,000
10,756
2,771
79.5%
20,000
8,780
2,360
78.8%
21,000
7,080
1,840
79.4%
22,000
5,813
1,528
79.2%
23,000
4,977
1,340
78.8%
24,000
3,991
1,087
78.6%
25,000
3,321
922
78.3%
Note: The above only includes cars that were 3 to 5 years old.
Average mileage by postcode.
Similarly to our 2017 analysis, London and the South East of England continue to be the lowest mileage drivers, with motorist in South West London covering the lowest average mileage in 2019.
As expected, more rural areas tended to see higher average mileage for 2019, with the Galashiels area (South East Scotland and North East England) boasting the highest average mileage for 2019 according to the MOT data.
Note that XX is a non-geographic postcode area used by online retailers for Royal Mail returns.
By Miles is a UK Pay-per-mile car insurer. Our monthly rolling contract and real-time itemised billing puts the driver back in control of their car insurance.
1. What is a connected car?
A connected car is a car that is equipped with internet access, allowing the car to share internet connectivity with other devices both inside and outside of the vehicle.
Connected cars are one part of the ever growing web of connected devices known as the Internet of Things (IoT). The IoT allows everyday items to have access to the internet so that you have more control over how and where you interact with them. Thanks to the IoT, we can now control and monitor things such as: heating (Nest, Hive), lighting (Hue), fitness (Fitbit), security (MyFox), music (Sonos) and even air quality (Awair).
You can either buy a device to connect your car to the internet or you can buy a vehicle that is already connected.
In the UK, Vodafone already offer a kit which when plugged in, can turn your car in to a WiFi hotspot. Vodafone use their 4G network to offer the same sort of connectivity you could get with your mobile phone.
Telematics devices, which look at your car health and performance, are now also using the cellular networks to add connectivity to your car. This connectivity is often “machine to machine” and so doesn’t offer the driver direct connectivity to the web. However some telematics providers are also starting to offer a WiFi hotspot too.
Car manufacturers (OEMs) are investing heavily into connected cars. OEMs understand that a connected car can create a real-time relationship with the driver that allows them to offer a better, broader and safer experience for their customers on an on-going basis.
On 28 April 2015 the European Parliament voted in favour of eCall regulation which requires all new cars be equipped with internet connectivity from April 2018. An eCall-equipped car will automatically contact the nearest emergency centre in case of a collision and tell it the location of the car.
So in essence, all new cars built in the EU from April 2018 will be connected cars.
3. Which car manufacturers are investing the most into connected cars?
Car manufacturers (OEMs) are investing heavily in both connected car and autonomous (self-drive) vehicle technologies. These two disciplines complement each other very well.
Autonomous vehicles are still seen as a thing of the future, where as connected cars are a current reality.
Most innovation is happening in Europe. The EU has led the call for eCall regulation. Large german OEMs like VW/Audi, Mercedes and BMW are forging ahead with the connected car. American and Asian OEMs are catching up quickly with Toyota looking to augment their established electric car positioning.
OEMs are hoping connected car technology will help improve vehicle management (both mechanical and logistics), safety, driver assistance (breakdown and traffic) and in-car entertainment.
4. How many connected cars are there?
In 2016, approximately 25 million connected cars were built. This is estimated to grow to around 90 million (75% of all cars built) by 2020. The total number of connected cars on the road by 2020 is expected to be about 250 million.
5. Are drivers concerned about their car becoming connected?
Drivers have have concerns about how the data collected by their connected car is used. Invasion of privacy is the number one concern for drivers.
Surveys have found that people are increasing willing to share data as long as they get something in return (for example, a better experience). And data is shared all the time about how people live their lives.
We have got used to our mobile phones sharing our location via Google traffic (to show traffic hotspots), or Strava recording our exercise routines or Netflix using our tv history to recommend new programs to us.
When asked how willing drivers are to share their data with OEMs, around 50% said they were happy if they got something in return, 30% we willing if that data was only used for research and the final 20% didn’t want any data shared.
6. How will connected cars affect my car insurance?
Telematic devices and the connected car open up new car insurance opportunities for drivers.
Pay-as-you-drive (PAYD) policies use data from the car to measure how it travels, typically so that low mileage drivers can benefit from lower premiums.
Pay-how-you-drive (PHYD) polices use data to measure driver behaviour. This means drivers can benefit from lower premiums if they have good driver habits.
Connected cars will give insurers more metrics about the driver so that they can create a more bespoke insurance tailored to the driver. The cost of the insurance policy will be more representative of the driver and car, rather than just based on old fashioned metrics like where what sort of job they do.
Usage based insurance (i.e. a combination of PAYD and PHYD polices) is growing year on year. The US and Italy markets have larger number of drivers who opt for UBI. The size of the market in the UK is growing at about 25% per year.
The main appeal of usage based insurance, is the reduction in insurance premium. Confused.com estimate savings on an average policy is likely to be around 30%. Confused.com believe 50% of drivers say they would use UBI if it could save them more than 20% on their policy premium.
Bonus: Real Data From Connected Cars
By Miles is looking to use data from connected cars to offer cheaper car insurance to lower mileage drivers.


